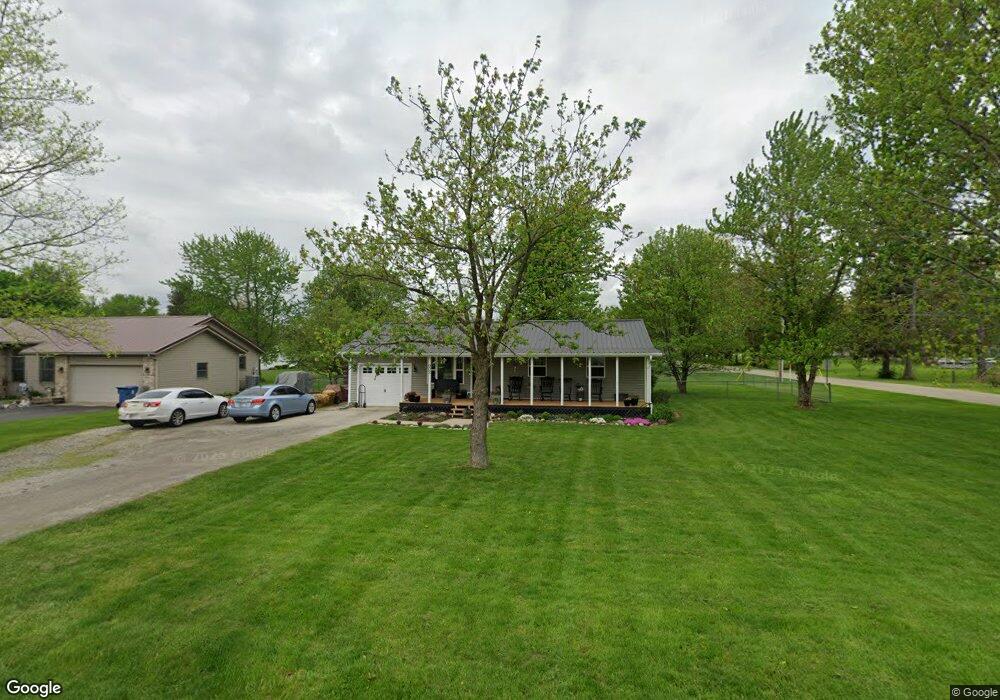
902 S Main St Fairmount, IN 46928
Estimated Value: $139,000 - $190,000
3
Beds
1
Bath
1,008
Sq Ft
$165/Sq Ft
Est. Value
About This Home
This home is located at 902 S Main St, Fairmount, IN 46928 and is currently estimated at $166,115, approximately $164 per square foot. 902 S Main St is a home located in Grant County with nearby schools including Madison-Grant Junior/Senior High School.
Ownership History
Date
Name
Owned For
Owner Type
Purchase Details
Closed on
Apr 24, 2020
Sold by
Elliott Jared D
Bought by
Elliott Gutierrez
Current Estimated Value
Home Financials for this Owner
Home Financials are based on the most recent Mortgage that was taken out on this home.
Original Mortgage
$81,496
Outstanding Balance
$72,331
Interest Rate
3.5%
Mortgage Type
New Conventional
Estimated Equity
$93,784
Purchase Details
Closed on
Feb 1, 2012
Sold by
Flagstar Bank
Bought by
Secretary Of Hud
Create a Home Valuation Report for This Property
The Home Valuation Report is an in-depth analysis detailing your home's value as well as a comparison with similar homes in the area
Home Values in the Area
Average Home Value in this Area
Purchase History
| Date | Buyer | Sale Price | Title Company |
|---|---|---|---|
| Elliott Gutierrez | -- | None Available | |
| Secretary Of Hud | -- | None Available |
Source: Public Records
Mortgage History
| Date | Status | Borrower | Loan Amount |
|---|---|---|---|
| Open | Elliott Gutierrez | $81,496 |
Source: Public Records
Tax History
| Year | Tax Paid | Tax Assessment Tax Assessment Total Assessment is a certain percentage of the fair market value that is determined by local assessors to be the total taxable value of land and additions on the property. | Land | Improvement |
|---|---|---|---|---|
| 2024 | $1,016 | $130,200 | $12,600 | $117,600 |
| 2023 | $894 | $117,300 | $12,600 | $104,700 |
| 2022 | $831 | $106,300 | $11,200 | $95,100 |
| 2021 | $644 | $91,600 | $11,200 | $80,400 |
| 2020 | $548 | $90,300 | $11,200 | $79,100 |
| 2019 | $494 | $86,200 | $10,500 | $75,700 |
| 2018 | $478 | $83,100 | $10,000 | $73,100 |
| 2017 | $427 | $81,100 | $10,000 | $71,100 |
| 2016 | $300 | $74,800 | $10,000 | $64,800 |
| 2014 | $344 | $78,300 | $13,300 | $65,000 |
| 2013 | $344 | $65,100 | $2,700 | $62,400 |
Source: Public Records
Map
Nearby Homes