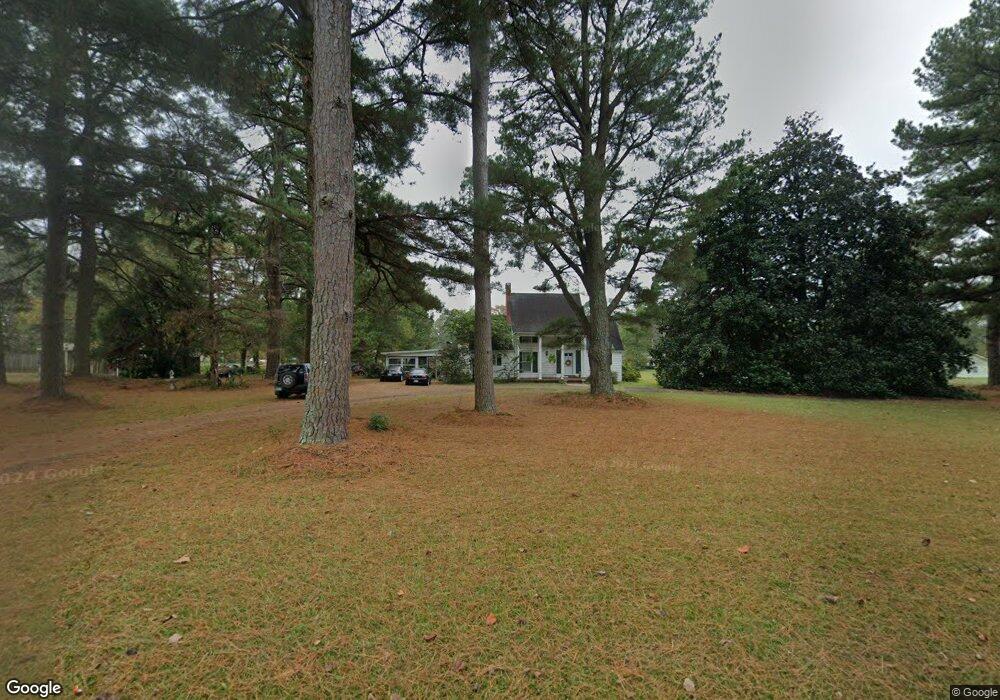
902 SE Van Buren St Idabel, OK 74745
Estimated Value: $77,000 - $145,840
4
Beds
2
Baths
1,472
Sq Ft
$72/Sq Ft
Est. Value
About This Home
This home is located at 902 SE Van Buren St, Idabel, OK 74745 and is currently estimated at $106,280, approximately $72 per square foot. 902 SE Van Buren St is a home located in McCurtain County with nearby schools including Idabel Primary South Elementary School, Central Elementary School, and Idabel Middle School.
Ownership History
Date
Name
Owned For
Owner Type
Purchase Details
Closed on
Aug 30, 2023
Sold by
Winship Johnnie R
Bought by
Winship Johnnie R and Winship John Paul
Current Estimated Value
Home Financials for this Owner
Home Financials are based on the most recent Mortgage that was taken out on this home.
Original Mortgage
$154,000
Interest Rate
6.81%
Mortgage Type
Construction
Purchase Details
Closed on
Sep 26, 2007
Sold by
Garrett Ernest Scott
Bought by
Coombs Pamela K
Home Financials for this Owner
Home Financials are based on the most recent Mortgage that was taken out on this home.
Original Mortgage
$74,000
Interest Rate
6.66%
Mortgage Type
Purchase Money Mortgage
Purchase Details
Closed on
Nov 20, 2000
Sold by
Garrett Ernest Scott
Bought by
Garrett Karyn
Purchase Details
Closed on
Jul 29, 1998
Sold by
Pike Jo Carole
Bought by
Garrett Ernest and Garrett Karyn
Purchase Details
Closed on
May 22, 1998
Sold by
Pike Jo Carole
Bought by
Pike Jo Carole
Create a Home Valuation Report for This Property
The Home Valuation Report is an in-depth analysis detailing your home's value as well as a comparison with similar homes in the area
Home Values in the Area
Average Home Value in this Area
Purchase History
| Date | Buyer | Sale Price | Title Company |
|---|---|---|---|
| Winship Johnnie R | -- | None Listed On Document | |
| Alvarado Raymundo | $45,000 | None Listed On Document | |
| Coombs Pamela K | $78,500 | None Available | |
| Garrett Karyn | -- | -- | |
| Garrett Ernest | $82,500 | -- | |
| Pike Jo Carole | -- | -- |
Source: Public Records
Mortgage History
| Date | Status | Borrower | Loan Amount |
|---|---|---|---|
| Closed | Winship Johnnie R | $154,000 | |
| Previous Owner | Coombs Pamela K | $74,000 |
Source: Public Records
Tax History Compared to Growth
Tax History
| Year | Tax Paid | Tax Assessment Tax Assessment Total Assessment is a certain percentage of the fair market value that is determined by local assessors to be the total taxable value of land and additions on the property. | Land | Improvement |
|---|---|---|---|---|
| 2024 | $612 | $7,160 | $715 | $6,445 |
| 2023 | $589 | $6,951 | $715 | $6,236 |
| 2022 | $707 | $8,136 | $715 | $7,421 |
| 2021 | $706 | $8,136 | $715 | $7,421 |
| 2020 | $736 | $8,309 | $715 | $7,594 |
| 2019 | $743 | $8,482 | $715 | $7,767 |
| 2018 | $762 | $8,655 | $715 | $7,940 |
| 2017 | $781 | $8,881 | $715 | $8,166 |
| 2016 | $753 | $8,881 | $715 | $8,166 |
| 2015 | $767 | $8,860 | $715 | $8,145 |
| 2014 | $779 | $8,860 | $715 | $8,145 |
Source: Public Records
Map
Nearby Homes
- 715 SE Avenue M
- 501 SE Ave J
- 705 SE Jefferson St
- 1011 SE Adams St
- 608 SE Ave d
- 602 Lynn Ln
- 801 SE Avenue C
- 801 NE Ave C
- 1604 SE Adams St
- 0 E Lincoln Rd
- 1702 SE Adams St
- 1400 Garfield St
- 1506 E Lincoln Rd
- 809 SW Bokhoma Ave
- 108 Stafford Ln
- 111 Banbury Ln
- 102 Banbury Ln
- 108 NE 3rd St
- 604 Manchester Dr
- 203 Warwick Ln
- 721 SE Ave L
- 906 SE Van Buren St
- 913 SE Van Buren St
- 810 SE Van Buren St
- 808 SE Ave L
- 810 SE Ave L
- 915 SE Van Buren St
- 806 SE Ave L
- 719 SE Ave L
- 919 SE Van Buren St
- 922 SE Van Buren St
- 619 SE Ave J
- 612 SE Ave J
- 0 Tbd Hwy 259 & Fisher Ln Unit 103649
- 0 Tbd E Lincoln Rd
- 710 SE Avenue J
- 722 SE Ave L
- 803 SE Ave K
- 802 SE Van Buren St
- 615 SE Ave J