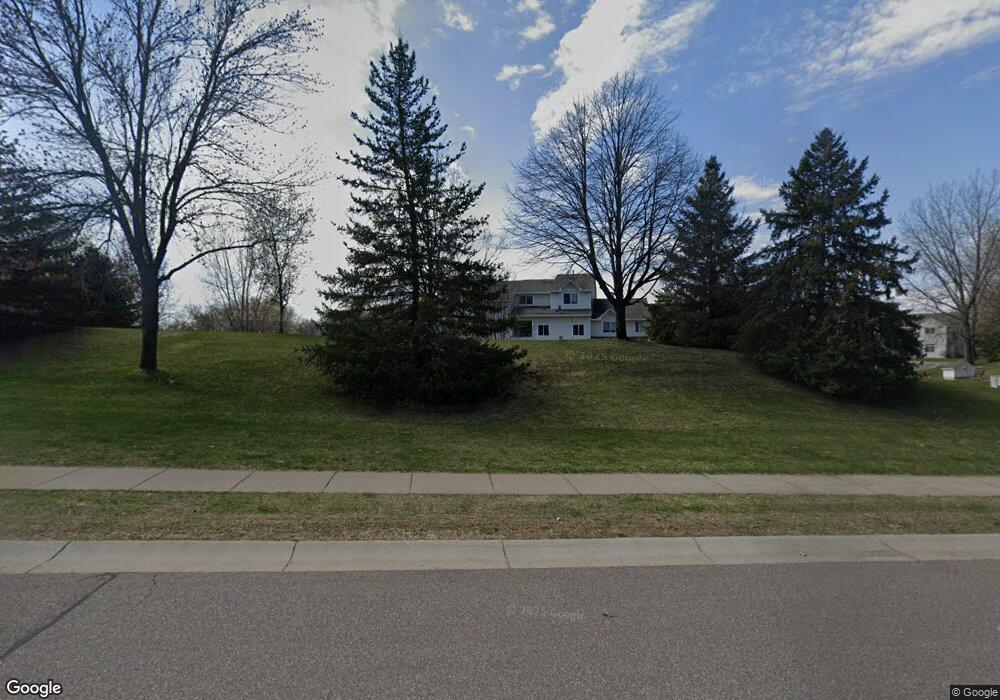
9020 9020 Sawgrass Glen Maple Grove, MN 55311
Estimated Value: $254,123 - $279,000
2
Beds
2
Baths
1,383
Sq Ft
$193/Sq Ft
Est. Value
About This Home
This home is located at 9020 9020 Sawgrass Glen, Maple Grove, MN 55311 and is currently estimated at $267,531, approximately $193 per square foot. 9020 9020 Sawgrass Glen is a home located in Hennepin County with nearby schools including Rush Creek Elementary School, Maple Grove Middle School, and Maple Grove Senior High School.
Ownership History
Date
Name
Owned For
Owner Type
Purchase Details
Closed on
Dec 5, 2012
Sold by
Secretary Of Housing & Urban Development
Bought by
Khatamgoya Naseem
Current Estimated Value
Home Financials for this Owner
Home Financials are based on the most recent Mortgage that was taken out on this home.
Original Mortgage
$122,761
Interest Rate
2.87%
Mortgage Type
FHA
Purchase Details
Closed on
Nov 15, 2012
Sold by
Sawgrass Glen Homeowners Association
Bought by
Secretary Of Housing & Urban Development
Home Financials for this Owner
Home Financials are based on the most recent Mortgage that was taken out on this home.
Original Mortgage
$122,761
Interest Rate
2.87%
Mortgage Type
FHA
Purchase Details
Closed on
Apr 24, 2012
Sold by
Us Bank
Bought by
Sami #1 Llc
Purchase Details
Closed on
Sep 1, 2011
Sold by
Anderson Melanie B
Bought by
Us Bank National Assoication
Purchase Details
Closed on
Feb 26, 1999
Sold by
Us Home Corp
Bought by
Anderson Melanie B
Create a Home Valuation Report for This Property
The Home Valuation Report is an in-depth analysis detailing your home's value as well as a comparison with similar homes in the area
Home Values in the Area
Average Home Value in this Area
Purchase History
| Date | Buyer | Sale Price | Title Company |
|---|---|---|---|
| Khatamgoya Naseem | -- | None Available | |
| Secretary Of Housing & Urban Development | -- | None Available | |
| Sami #1 Llc | $4,336 | -- | |
| Us Bank National Assoication | $135,171 | -- | |
| Us Bank National Assoication | $135,171 | -- | |
| Anderson Melanie B | $130,555 | -- |
Source: Public Records
Mortgage History
| Date | Status | Borrower | Loan Amount |
|---|---|---|---|
| Previous Owner | Khatamgoya Naseem | $122,761 |
Source: Public Records
Tax History Compared to Growth
Tax History
| Year | Tax Paid | Tax Assessment Tax Assessment Total Assessment is a certain percentage of the fair market value that is determined by local assessors to be the total taxable value of land and additions on the property. | Land | Improvement |
|---|---|---|---|---|
| 2024 | $2,956 | $243,300 | $61,500 | $181,800 |
| 2023 | $3,288 | $270,200 | $88,800 | $181,400 |
| 2022 | $2,543 | $249,300 | $58,200 | $191,100 |
| 2021 | $2,327 | $205,400 | $37,600 | $167,800 |
| 2020 | $2,370 | $185,900 | $24,000 | $161,900 |
| 2019 | $2,168 | $180,900 | $30,500 | $150,400 |
| 2018 | $2,120 | $174,600 | $35,400 | $139,200 |
| 2017 | $1,811 | $143,400 | $25,000 | $118,400 |
| 2016 | $1,758 | $138,500 | $25,000 | $113,500 |
| 2015 | $1,785 | $137,000 | $29,000 | $108,000 |
| 2014 | -- | $128,800 | $32,500 | $96,300 |
Source: Public Records
Map
Nearby Homes
- 18244 88th Place N
- 9363 Tewsbury Gate N
- 18053 90th Place N
- 9365 Tewsbury Bend
- 8688 Vagabond Ln N
- 19301 Schutte Rd
- 18644 85th Ave N
- 9125 Olive Ln N
- 9245 Cherry Ln
- 9260 Merrimac Ln N
- 17475 90th Ave N
- 17913 96th Ave N
- 8200 Walnut Grove Ln N
- 17868 96th Ave N
- 18502 97th Place N Unit 2204
- 18093 83rd Ave N
- 10145 Peony Ln N
- 10154 Peony Ln N
- 9803 Vagabond Ln N
- 8300 County Road 116
- 9022 9022 Sawgrass Glen N
- 9024 9024 Sawgrass-Glen-n
- 9024 9024 Sawgrass Glen
- 9016 9016 Sawgrass Glen N
- 9042 Sawgrass Glen
- 9005 9005 Sawgrass Glen N
- 9010 Sawgrass Glen
- 9014 Sawgrass Glen
- 9016 Sawgrass Glen Unit 505
- 9020 Sawgrass Glen Unit 504
- 9026 Sawgrass Glen
- 9024 Sawgrass Glen
- 9020 Sawgrass Glen
- 9022 Sawgrass Glen
- 9022 Sawgrass Glen
- 9024 Sawgrass Glen
- 9022 Sawgrass Glen N
- 9024 Sawgrass Glen N
- 9051 Tewsbury Gate
- 9005 Sawgrass Glen N