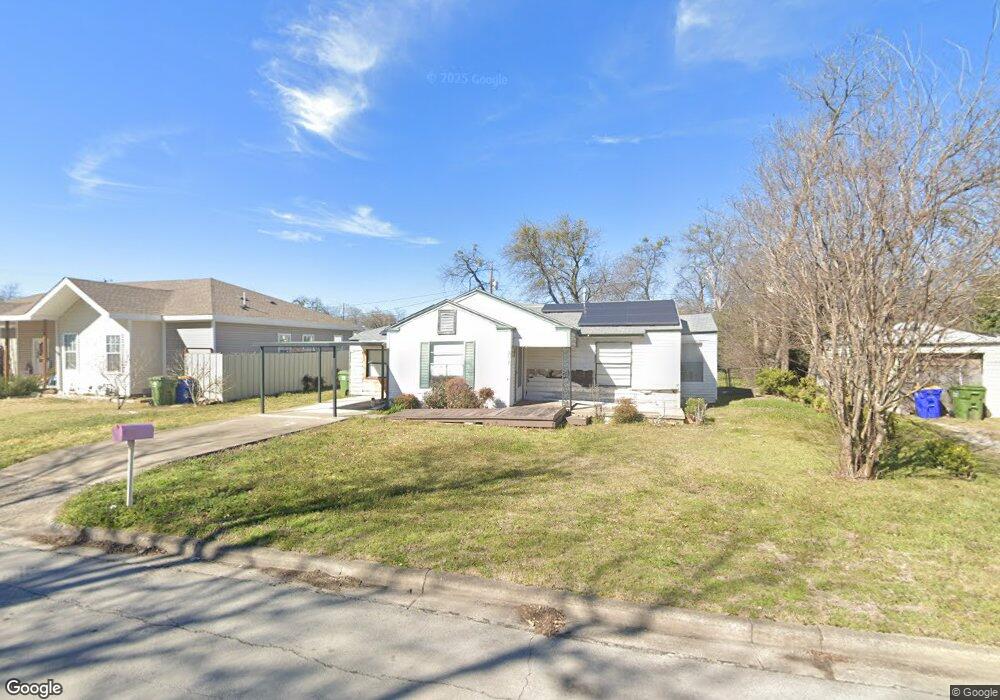
9020 Oels St Fort Worth, TX 76108
Estimated Value: $166,000 - $216,000
3
Beds
1
Bath
1,135
Sq Ft
$171/Sq Ft
Est. Value
About This Home
This home is located at 9020 Oels St, Fort Worth, TX 76108 and is currently estimated at $193,795, approximately $170 per square foot. 9020 Oels St is a home located in Tarrant County with nearby schools including West Elementary School, Brewer Middle School, and Tannahill Intermediate School.
Ownership History
Date
Name
Owned For
Owner Type
Purchase Details
Closed on
Nov 15, 1999
Sold by
Craig John Adrian
Bought by
Adcock Bobby J and Adcock Shirley J
Current Estimated Value
Home Financials for this Owner
Home Financials are based on the most recent Mortgage that was taken out on this home.
Original Mortgage
$50,898
Outstanding Balance
$15,693
Interest Rate
7.88%
Mortgage Type
VA
Estimated Equity
$178,102
Purchase Details
Closed on
Sep 25, 1996
Sold by
Craig Karen
Bought by
Craig John Adrian
Home Financials for this Owner
Home Financials are based on the most recent Mortgage that was taken out on this home.
Original Mortgage
$30,555
Interest Rate
8.09%
Purchase Details
Closed on
Jun 13, 1996
Sold by
Slayton Mark Allen and Slayton Waylon J
Bought by
Slayton Belinda J
Create a Home Valuation Report for This Property
The Home Valuation Report is an in-depth analysis detailing your home's value as well as a comparison with similar homes in the area
Home Values in the Area
Average Home Value in this Area
Purchase History
| Date | Buyer | Sale Price | Title Company |
|---|---|---|---|
| Adcock Bobby J | -- | Commerce Land Title Inc | |
| Craig John Adrian | -- | Commerce Land Title | |
| Slayton Belinda J | -- | Centex Title Company |
Source: Public Records
Mortgage History
| Date | Status | Borrower | Loan Amount |
|---|---|---|---|
| Open | Adcock Bobby J | $50,898 | |
| Previous Owner | Craig John Adrian | $30,555 |
Source: Public Records
Tax History Compared to Growth
Tax History
| Year | Tax Paid | Tax Assessment Tax Assessment Total Assessment is a certain percentage of the fair market value that is determined by local assessors to be the total taxable value of land and additions on the property. | Land | Improvement |
|---|---|---|---|---|
| 2025 | $2,759 | $165,000 | $50,671 | $114,329 |
| 2024 | $2,759 | $193,259 | $50,671 | $142,588 |
| 2023 | $3,976 | $199,661 | $50,671 | $148,990 |
| 2022 | $4,117 | $152,025 | $25,000 | $127,025 |
| 2021 | $2,134 | $114,516 | $25,000 | $89,516 |
| 2020 | $1,955 | $95,964 | $25,000 | $70,964 |
| 2019 | $1,845 | $106,700 | $25,000 | $81,700 |
| 2018 | $100 | $58,298 | $12,000 | $46,298 |
| 2017 | $1,549 | $74,093 | $12,000 | $62,093 |
| 2016 | $1,408 | $83,182 | $12,000 | $71,182 |
| 2015 | -- | $43,800 | $12,400 | $31,400 |
| 2014 | -- | $43,800 | $12,400 | $31,400 |
Source: Public Records
Map
Nearby Homes
- 9100 Rowland Dr
- 9200 Farmers Rd
- 9104 White Settlement Rd
- 405 S Las Vegas Trail
- 407 S Las Vegas Trail
- 428 S Las Vegas Trail
- 409 S Las Vegas Trail
- 411 S Las Vegas Trail
- 9221 White Settlement Rd
- 508 Grant Cir
- 2860 Fox Trail Ln
- 10937 Elata Dr
- 201 N Normandale St
- 501 Allencrest Dr
- 204 Lanham Ct
- 105 Lockwood St
- 641 S Redford Ln
- 8528 Pemberton Ct
- 800 Pemberton St
- 501 Pemberton St