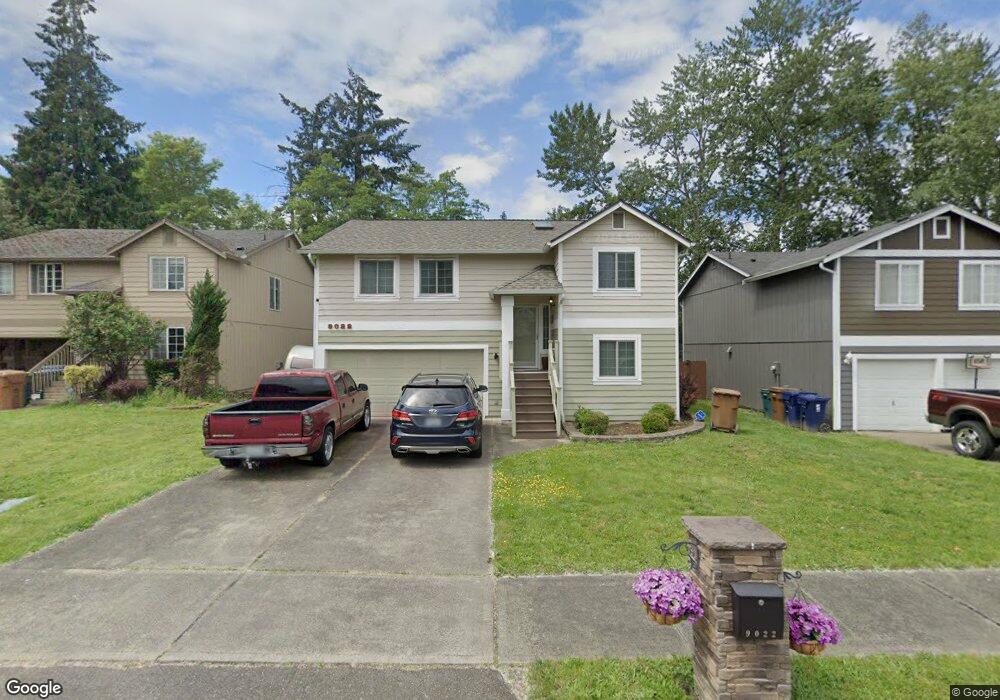
9022 E F St Tacoma, WA 98445
South End NeighborhoodEstimated Value: $489,000 - $552,000
4
Beds
3
Baths
1,902
Sq Ft
$278/Sq Ft
Est. Value
About This Home
This home is located at 9022 E F St, Tacoma, WA 98445 and is currently estimated at $528,217, approximately $277 per square foot. 9022 E F St is a home located in Pierce County with nearby schools including Larchmont Elementary School, Baker Middle School, and Mount Tahoma High School.
Ownership History
Date
Name
Owned For
Owner Type
Purchase Details
Closed on
Feb 12, 2020
Sold by
Mason Adrian
Bought by
Mason Latoya
Current Estimated Value
Purchase Details
Closed on
Jul 2, 2002
Sold by
United Svgs & Loan Bank
Bought by
Mason Adrian L and Mason Latoya P
Home Financials for this Owner
Home Financials are based on the most recent Mortgage that was taken out on this home.
Original Mortgage
$154,082
Outstanding Balance
$65,643
Interest Rate
6.78%
Mortgage Type
FHA
Estimated Equity
$462,574
Purchase Details
Closed on
Feb 11, 2002
Sold by
Om Ki Hwan
Bought by
United S & L Bank
Purchase Details
Closed on
Apr 23, 1999
Sold by
Crest Builders Inc
Bought by
Om Ki Hwan and Om Tong Suk
Home Financials for this Owner
Home Financials are based on the most recent Mortgage that was taken out on this home.
Original Mortgage
$109,200
Interest Rate
7.62%
Create a Home Valuation Report for This Property
The Home Valuation Report is an in-depth analysis detailing your home's value as well as a comparison with similar homes in the area
Home Values in the Area
Average Home Value in this Area
Purchase History
| Date | Buyer | Sale Price | Title Company |
|---|---|---|---|
| Mason Latoya | -- | None Available | |
| Mason Adrian L | $156,500 | Chicago Title | |
| United S & L Bank | $118,531 | -- | |
| Om Ki Hwan | $158,803 | First American Title Ins Co |
Source: Public Records
Mortgage History
| Date | Status | Borrower | Loan Amount |
|---|---|---|---|
| Open | Mason Adrian L | $154,082 | |
| Previous Owner | Om Ki Hwan | $109,200 | |
| Closed | Om Ki Hwan | $13,650 |
Source: Public Records
Tax History Compared to Growth
Tax History
| Year | Tax Paid | Tax Assessment Tax Assessment Total Assessment is a certain percentage of the fair market value that is determined by local assessors to be the total taxable value of land and additions on the property. | Land | Improvement |
|---|---|---|---|---|
| 2025 | $4,849 | $474,600 | $168,200 | $306,400 |
| 2024 | $4,849 | $473,200 | $170,000 | $303,200 |
| 2023 | $4,849 | $435,500 | $163,000 | $272,500 |
| 2022 | $4,360 | $451,400 | $153,600 | $297,800 |
| 2021 | $4,036 | $321,000 | $100,700 | $220,300 |
| 2019 | $3,537 | $298,600 | $86,200 | $212,400 |
| 2018 | $3,786 | $272,100 | $70,000 | $202,100 |
| 2017 | $3,281 | $239,600 | $52,400 | $187,200 |
| 2016 | $2,883 | $179,500 | $39,600 | $139,900 |
| 2014 | $2,349 | $165,800 | $38,500 | $127,300 |
| 2013 | $2,349 | $144,600 | $32,600 | $112,000 |
Source: Public Records
Map
Nearby Homes