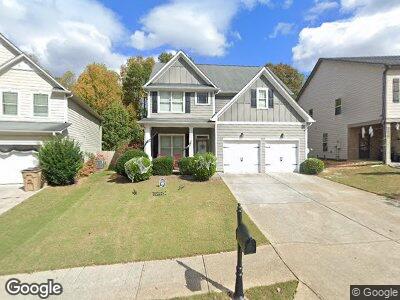
9024 Lexington Ct Unit 113 Braselton, GA 30517
Estimated Value: $371,000 - $442,000
4
Beds
3
Baths
2,331
Sq Ft
$173/Sq Ft
Est. Value
About This Home
This home is located at 9024 Lexington Ct Unit 113, Braselton, GA 30517 and is currently estimated at $402,718, approximately $172 per square foot. 9024 Lexington Ct Unit 113 is a home located in Jackson County with nearby schools including West Jackson Elementary School, West Jackson Middle School, and Jackson County High School.
Ownership History
Date
Name
Owned For
Owner Type
Purchase Details
Closed on
Jun 30, 2017
Sold by
Young Caitlin
Bought by
Zanardo Steven
Current Estimated Value
Home Financials for this Owner
Home Financials are based on the most recent Mortgage that was taken out on this home.
Original Mortgage
$214,000
Outstanding Balance
$180,169
Interest Rate
3.94%
Mortgage Type
VA
Estimated Equity
$222,549
Purchase Details
Closed on
May 28, 2014
Sold by
Hoffman Hannah A
Bought by
Young Caitlin and Young Jonathan Blake
Home Financials for this Owner
Home Financials are based on the most recent Mortgage that was taken out on this home.
Original Mortgage
$154,156
Interest Rate
4.4%
Mortgage Type
FHA
Purchase Details
Closed on
Oct 26, 2007
Sold by
Not Provided
Bought by
Hoffman Hannah A and Graves Tyler G
Purchase Details
Closed on
Aug 6, 2007
Sold by
Not Provided
Bought by
Hoffman Hannah A and Graves Tyler G
Create a Home Valuation Report for This Property
The Home Valuation Report is an in-depth analysis detailing your home's value as well as a comparison with similar homes in the area
Home Values in the Area
Average Home Value in this Area
Purchase History
| Date | Buyer | Sale Price | Title Company |
|---|---|---|---|
| Zanardo Steven | $214,000 | -- | |
| Young Caitlin | $157,000 | -- | |
| Hoffman Hannah A | $182,000 | -- | |
| Hoffman Hannah A | $90,000 | -- |
Source: Public Records
Mortgage History
| Date | Status | Borrower | Loan Amount |
|---|---|---|---|
| Open | Zanardo Steven | $214,000 | |
| Previous Owner | Young Caitlin | $154,156 | |
| Previous Owner | Hoffman Graves Hannah A | $176,500 |
Source: Public Records
Tax History Compared to Growth
Tax History
| Year | Tax Paid | Tax Assessment Tax Assessment Total Assessment is a certain percentage of the fair market value that is determined by local assessors to be the total taxable value of land and additions on the property. | Land | Improvement |
|---|---|---|---|---|
| 2024 | $592 | $137,920 | $24,800 | $113,120 |
| 2023 | $592 | $125,520 | $24,800 | $100,720 |
| 2022 | $141 | $106,160 | $24,800 | $81,360 |
| 2021 | $3,659 | $100,560 | $19,200 | $81,360 |
| 2020 | $3,192 | $90,760 | $19,200 | $71,560 |
| 2019 | $3,114 | $87,000 | $15,440 | $71,560 |
| 2018 | $3,021 | $83,640 | $15,440 | $68,200 |
| 2017 | $2,781 | $78,252 | $15,440 | $62,812 |
| 2016 | $2,583 | $72,542 | $15,440 | $57,102 |
| 2015 | $2,236 | $67,102 | $10,000 | $57,102 |
| 2014 | $1,976 | $54,908 | $10,000 | $44,908 |
| 2013 | -- | $50,978 | $10,000 | $40,978 |
Source: Public Records
Map
Nearby Homes
- 7261 Silk Tree Pointe
- 7230 Silk Tree Pointe
- 9565 Rushmore Cir
- 6813 Grand Hickory Dr
- 3247 Hawthorne Path
- 3227 Hawthorne Path
- 3214 Hawthorne Path
- 6683 Grand Hickory Dr
- 2659 Red Mulberry Ln
- 1913 Henderson Falls Way
- 2688 Red Mulberry Ln
- 3137 Hawthorne Path
- 6963 Grand Hickory Dr
- 1903 Henderson Falls Way
- 6453 Mossy Oak Landing
- 1399 Kilchis Falls Way
- 1609 Sahale Falls Dr
- 181 Catalpa Grove
- 9024 Lexington Ct Unit 113
- 9024 Lexington Ct
- 9020 Lexington Ct
- 9020 Lexington Ct
- 9016 Lexington Ct
- 9032 Lexington Ct
- 9012 Lexington Ct
- 7371 Silk Tree Pointe
- 7381 Silk Tree Pointe
- 0 Lexington Ct Unit 8693261
- 0 Lexington Ct Unit 8613681
- 0 Lexington Ct Unit 8081823
- 0 Lexington Ct Unit 7562198
- 0 Lexington Ct Unit 7115322
- 0 Lexington Ct Unit 8136564
- 0 Lexington Ct Unit 9010834
- 0 Lexington Ct Unit 9029450
- 0 Lexington Ct Unit 9038454
- 0 Lexington Ct Unit 8852488