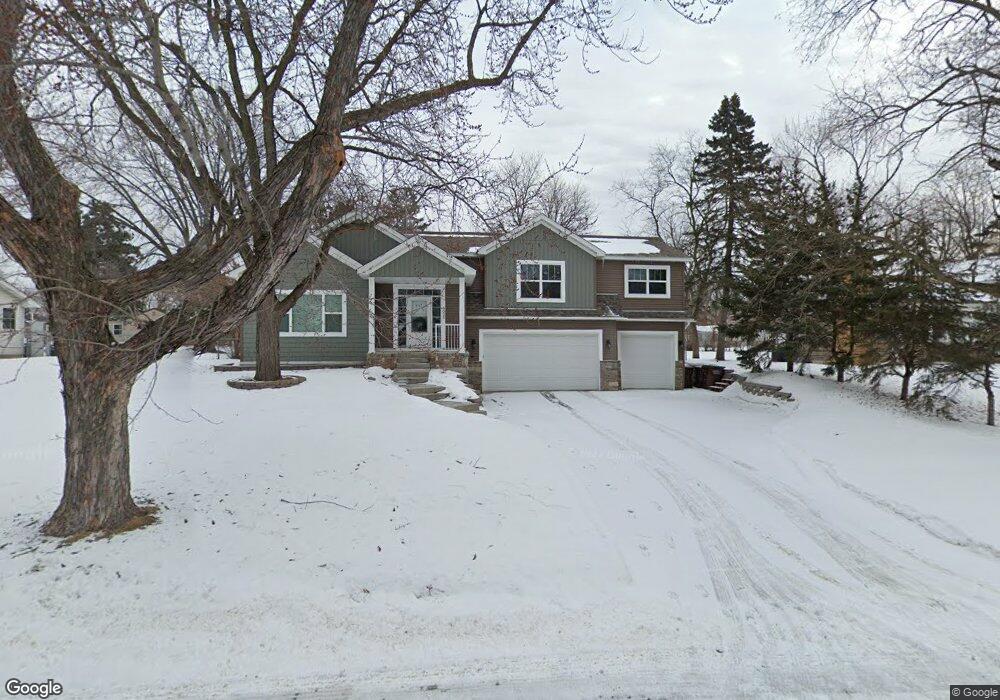
9025 Emerson Ave S Bloomington, MN 55420
East Bloomington NeighborhoodEstimated Value: $474,000 - $547,000
4
Beds
4
Baths
1,056
Sq Ft
$478/Sq Ft
Est. Value
About This Home
This home is located at 9025 Emerson Ave S, Bloomington, MN 55420 and is currently estimated at $505,059, approximately $478 per square foot. 9025 Emerson Ave S is a home located in Hennepin County with nearby schools including Washburn Elementary School, Valley View Middle School, and Kennedy Senior High School.
Ownership History
Date
Name
Owned For
Owner Type
Purchase Details
Closed on
May 25, 2018
Sold by
Blanchard Amanda and Blanchard Stephane
Bought by
Craton David and Parlin Lauren
Current Estimated Value
Home Financials for this Owner
Home Financials are based on the most recent Mortgage that was taken out on this home.
Original Mortgage
$320,800
Outstanding Balance
$276,219
Interest Rate
4.4%
Mortgage Type
New Conventional
Estimated Equity
$228,840
Purchase Details
Closed on
Jun 10, 2015
Sold by
Jps Homes Llc
Bought by
Blanchard Stephane and Blanchard Amanda
Home Financials for this Owner
Home Financials are based on the most recent Mortgage that was taken out on this home.
Original Mortgage
$314,900
Interest Rate
2.87%
Mortgage Type
Adjustable Rate Mortgage/ARM
Purchase Details
Closed on
Jul 3, 2014
Sold by
Klueh Anne St Martin
Bought by
Jps Homes Llc
Create a Home Valuation Report for This Property
The Home Valuation Report is an in-depth analysis detailing your home's value as well as a comparison with similar homes in the area
Home Values in the Area
Average Home Value in this Area
Purchase History
| Date | Buyer | Sale Price | Title Company |
|---|---|---|---|
| Craton David | $401,000 | North American Titel Co | |
| Blanchard Stephane | $349,900 | Land Title Inc | |
| Jps Homes Llc | $50,000 | Land Title Inc |
Source: Public Records
Mortgage History
| Date | Status | Borrower | Loan Amount |
|---|---|---|---|
| Open | Craton David | $320,800 | |
| Previous Owner | Blanchard Stephane | $314,900 |
Source: Public Records
Tax History Compared to Growth
Tax History
| Year | Tax Paid | Tax Assessment Tax Assessment Total Assessment is a certain percentage of the fair market value that is determined by local assessors to be the total taxable value of land and additions on the property. | Land | Improvement |
|---|---|---|---|---|
| 2024 | $6,012 | $466,200 | $130,000 | $336,200 |
| 2023 | $5,684 | $471,300 | $135,200 | $336,100 |
| 2022 | $5,006 | $447,000 | $128,800 | $318,200 |
| 2021 | $4,803 | $391,300 | $117,900 | $273,400 |
| 2020 | $5,211 | $379,900 | $114,500 | $265,400 |
| 2019 | $4,939 | $399,000 | $114,500 | $284,500 |
| 2018 | $4,780 | $372,900 | $115,200 | $257,700 |
| 2017 | $4,389 | $328,500 | $100,900 | $227,600 |
| 2016 | $1,293 | $113,400 | $93,400 | $20,000 |
| 2015 | $1,958 | $130,600 | $90,600 | $40,000 |
| 2014 | -- | $142,700 | $87,800 | $54,900 |
Source: Public Records
Map
Nearby Homes
- 8706 Aldrich Ave S
- 2101 W 89th St
- 9020 Blaisdell Ave S
- 9149 Queen Ave S
- 8831 Queen Ave S
- 9522 Pleasant Ave S
- 2300 W 95th St
- 8545 Penn Ave S
- 8525 Penn Ave S
- 9540 Penn Cir
- 8345 Knox Ave S
- 8549 Russell Ave S
- 9824 Fremont Ave S
- 8212 Fremont Ave S Unit D
- 9609 Vincent Ave S
- 8114 Emerson Ave S
- 8429 1st Ave S
- 8237 Pillsbury Ave S
- 8232 Wentworth Ave S
- 1114 W 80th 1 2 St
- 9019 Emerson Ave S
- 9031 Emerson Ave S
- 9024 Dupont Ave S
- 9018 Dupont Ave S
- 9037 Emerson Ave S
- 9013 Emerson Ave S
- 9032 Dupont Ave S
- 9012 Dupont Ave S
- 9024 Emerson Ave S
- 9018 Emerson Ave S
- 9030 Emerson Ave S
- 9043 Emerson Ave S
- 9100 Dupont Ave S
- 9036 Emerson Ave S
- 9006 Dupont Ave S
- 9001 Emerson Ave S
- 9000 Emerson Ave S
- 9029 Dupont Ave S
- 9106 Dupont Ave S
- 9031 Fremont Ave S