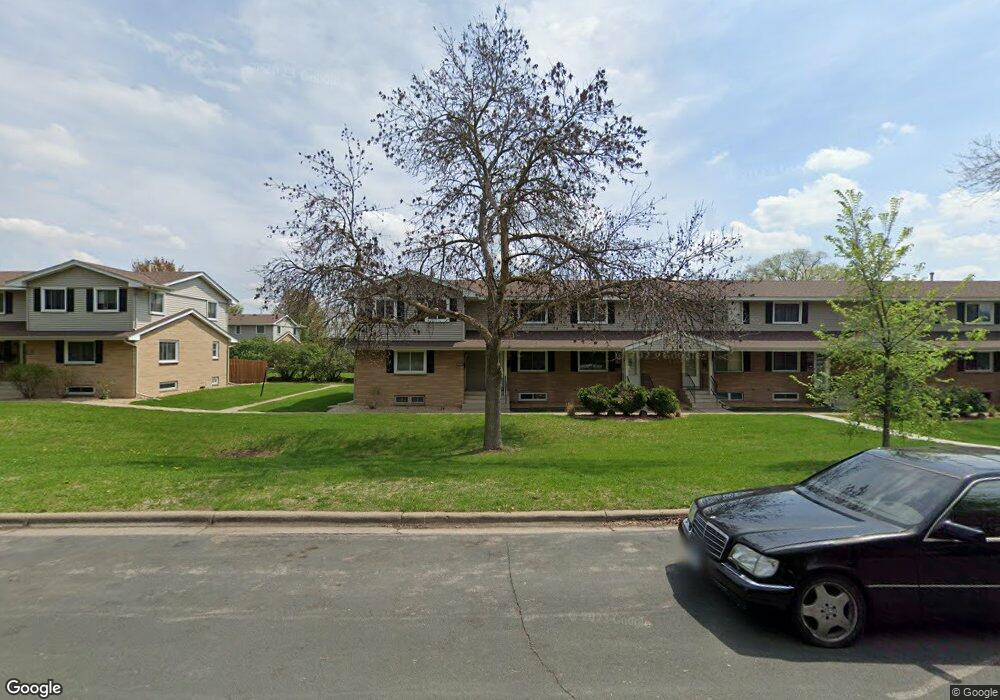
9027 18th Ave S Bloomington, MN 55425
East Bloomington NeighborhoodEstimated Value: $182,199 - $222,000
2
Beds
2
Baths
432
Sq Ft
$450/Sq Ft
Est. Value
About This Home
This home is located at 9027 18th Ave S, Bloomington, MN 55425 and is currently estimated at $194,550, approximately $450 per square foot. 9027 18th Ave S is a home located in Hennepin County with nearby schools including Indian Mounds Elementary School, Valley View Middle School, and Kennedy Senior High School.
Ownership History
Date
Name
Owned For
Owner Type
Purchase Details
Closed on
Mar 28, 2016
Sold by
Olson Mark
Bought by
Avalon Home Investments Llc
Current Estimated Value
Home Financials for this Owner
Home Financials are based on the most recent Mortgage that was taken out on this home.
Original Mortgage
$59,000
Outstanding Balance
$46,826
Interest Rate
3.65%
Mortgage Type
Purchase Money Mortgage
Estimated Equity
$147,724
Purchase Details
Closed on
Oct 1, 2015
Sold by
Federal Home Loan Mortgage Corporation
Bought by
Olson Mark
Purchase Details
Closed on
Jan 12, 2015
Sold by
Wells Fargo Bank Na
Bought by
Federal Home Loan Mortgage Corporation
Purchase Details
Closed on
Nov 14, 2014
Sold by
Bunting Susan
Bought by
Wells Fargo Bank Na
Purchase Details
Closed on
Jun 18, 2014
Sold by
Polomis Nancy T
Bought by
Brentwood Homes Association Inc
Purchase Details
Closed on
Dec 24, 1991
Sold by
Bank Of America
Bought by
Bunting Susan K
Create a Home Valuation Report for This Property
The Home Valuation Report is an in-depth analysis detailing your home's value as well as a comparison with similar homes in the area
Home Values in the Area
Average Home Value in this Area
Purchase History
| Date | Buyer | Sale Price | Title Company |
|---|---|---|---|
| Avalon Home Investments Llc | -- | Land Title Inc | |
| Olson Mark | -- | Title One Inc | |
| Federal Home Loan Mortgage Corporation | -- | None Available | |
| Wells Fargo Bank Na | $80,851 | None Available | |
| Brentwood Homes Association Inc | $5,094 | None Available | |
| Bunting Susan K | $47,700 | -- |
Source: Public Records
Mortgage History
| Date | Status | Borrower | Loan Amount |
|---|---|---|---|
| Open | Avalon Home Investments Llc | $59,000 | |
| Closed | Bunting Susan K | -- |
Source: Public Records
Tax History
| Year | Tax Paid | Tax Assessment Tax Assessment Total Assessment is a certain percentage of the fair market value that is determined by local assessors to be the total taxable value of land and additions on the property. | Land | Improvement |
|---|---|---|---|---|
| 2024 | $2,283 | $177,100 | $25,000 | $152,100 |
| 2023 | $2,087 | $174,500 | $25,000 | $149,500 |
| 2022 | $1,965 | $178,900 | $25,000 | $153,900 |
| 2021 | $1,862 | $154,100 | $24,000 | $130,100 |
| 2020 | $2,048 | $147,500 | $23,600 | $123,900 |
| 2019 | $1,728 | $157,700 | $23,600 | $134,100 |
| 2018 | $1,742 | $130,500 | $23,700 | $106,800 |
| 2017 | $1,454 | $105,400 | $21,400 | $84,000 |
| 2016 | $1,296 | $88,500 | $20,500 | $68,000 |
| 2015 | $1,328 | $87,100 | $20,100 | $67,000 |
| 2014 | -- | $88,500 | $19,800 | $68,700 |
Source: Public Records
Map
Nearby Homes
- 9039 18th Ave S
- 8935 Old Cedar Ave S Unit 211
- 9012 14th Ave S
- 9400 Old Cedar Ave S Unit 119
- 2113 E 86th St
- 2437 Skyline Dr
- 8849 Columbus Ave S
- 8416 22nd Ave S
- 9523 10th Ave S
- 8624 Columbus Ave S
- 8317 15th Ave S
- 8324 14th Ave S
- 8209 11th Ave S
- 9701 Oakland Ave S
- 9600 Portland Ave S Unit 107
- 9600 Portland Ave S Unit 109
- 8715 2nd Ave S
- 9700 Portland Ave S Unit 332
- 9700 Portland Ave S Unit 127
- 10035 Mound Spring Terrace
- 9029 18th Ave S
- 9025 18th Ave S
- 9031 18th Ave S
- 9033 18th Ave S
- 9035 18th Ave S
- 9023 18th Ave S
- 9037 18th Ave S
- 9021 18th Ave S
- 9019 18th Ave S
- 9019 18th Ave S Unit 210
- 9026 Old Cedar Ave S
- 9024 Old Cedar Ave S
- 9028 Old Cedar Ave S
- 9022 Old Cedar Ave S
- 9030 Old Cedar Ave S
- 9017 18th Ave S
- 9032 Old Cedar Ave S
- 9020 Old Cedar Ave S
- 9034 Old Cedar Ave S
- 9015 18th Ave S
Your Personal Tour Guide
Ask me questions while you tour the home.