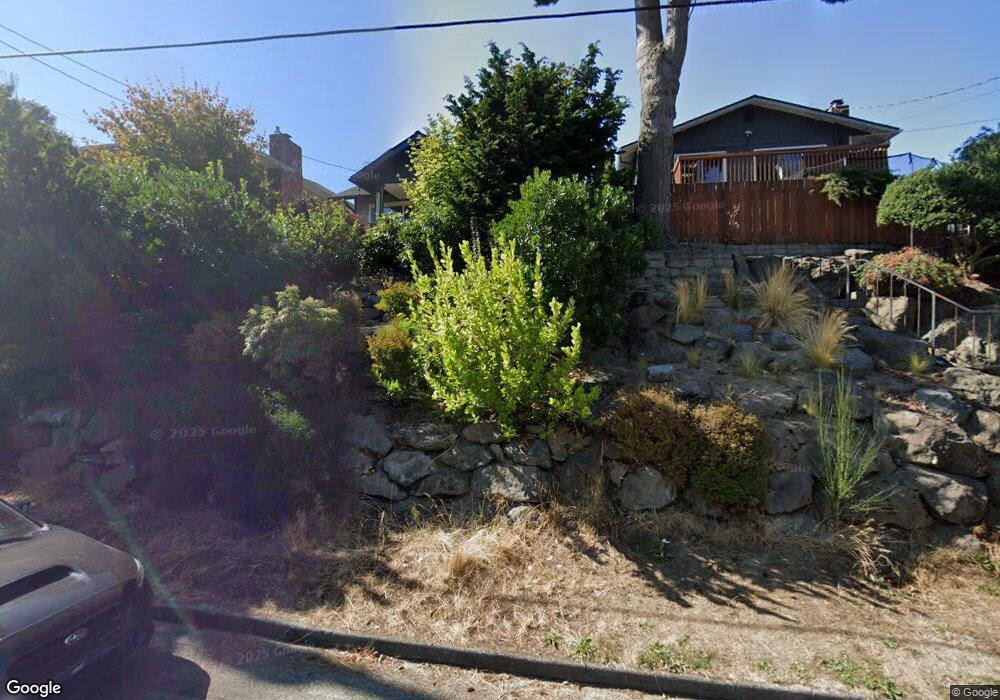
9027 6th Ave NW Seattle, WA 98117
Greenwood NeighborhoodEstimated Value: $810,000 - $986,000
3
Beds
1
Bath
1,460
Sq Ft
$611/Sq Ft
Est. Value
About This Home
This home is located at 9027 6th Ave NW, Seattle, WA 98117 and is currently estimated at $892,709, approximately $611 per square foot. 9027 6th Ave NW is a home located in King County with nearby schools including Loyal Heights Elementary School, Whitman Middle School, and Ingraham High School.
Ownership History
Date
Name
Owned For
Owner Type
Purchase Details
Closed on
Jun 22, 2000
Sold by
Muselwhite Julie A
Bought by
Romain Michael J
Current Estimated Value
Home Financials for this Owner
Home Financials are based on the most recent Mortgage that was taken out on this home.
Original Mortgage
$250,990
Outstanding Balance
$87,600
Interest Rate
8.08%
Estimated Equity
$805,109
Purchase Details
Closed on
May 27, 1998
Sold by
Cooper Lisa M and Mcmorran Michelle
Bought by
Muselwhite Julie A
Home Financials for this Owner
Home Financials are based on the most recent Mortgage that was taken out on this home.
Original Mortgage
$137,200
Interest Rate
7.13%
Purchase Details
Closed on
Jan 23, 1997
Sold by
Walters Ruth
Bought by
Mcmorran Michelle and Cooper Lisa M
Home Financials for this Owner
Home Financials are based on the most recent Mortgage that was taken out on this home.
Original Mortgage
$132,750
Interest Rate
7.74%
Create a Home Valuation Report for This Property
The Home Valuation Report is an in-depth analysis detailing your home's value as well as a comparison with similar homes in the area
Home Values in the Area
Average Home Value in this Area
Purchase History
| Date | Buyer | Sale Price | Title Company |
|---|---|---|---|
| Romain Michael J | $264,200 | First American | |
| Muselwhite Julie A | $171,500 | Fidelity National Title | |
| Mcmorran Michelle | $139,750 | Fidelity National Title |
Source: Public Records
Mortgage History
| Date | Status | Borrower | Loan Amount |
|---|---|---|---|
| Open | Romain Michael J | $250,990 | |
| Previous Owner | Muselwhite Julie A | $137,200 | |
| Previous Owner | Mcmorran Michelle | $132,750 |
Source: Public Records
Tax History Compared to Growth
Tax History
| Year | Tax Paid | Tax Assessment Tax Assessment Total Assessment is a certain percentage of the fair market value that is determined by local assessors to be the total taxable value of land and additions on the property. | Land | Improvement |
|---|---|---|---|---|
| 2024 | $7,478 | $738,000 | $505,000 | $233,000 |
| 2023 | $6,883 | $719,000 | $476,000 | $243,000 |
| 2022 | $6,601 | $763,000 | $425,000 | $338,000 |
| 2021 | $5,906 | $674,000 | $387,000 | $287,000 |
| 2020 | $5,901 | $568,000 | $323,000 | $245,000 |
| 2018 | $5,485 | $596,000 | $310,000 | $286,000 |
| 2017 | $4,514 | $522,000 | $227,000 | $295,000 |
| 2016 | $4,197 | $440,000 | $191,000 | $249,000 |
| 2015 | $3,628 | $400,000 | $174,000 | $226,000 |
| 2014 | -- | $352,000 | $156,000 | $196,000 |
| 2013 | -- | $320,000 | $142,000 | $178,000 |
Source: Public Records
Map
Nearby Homes
- 9029 8th Ave NW Unit C
- 9015 Dibble Ave NW
- 8841 Dibble Ave NW
- 9218 4th Ave NW
- 9253 6th Ave NW Unit b
- 9253 6th Ave NW
- 8712 12th Ave NW
- 630 NW 85th St Unit A
- 652 NW 85th St
- 317 NW 86th St
- 326 -330 NW 85th St
- 633 NW 85th St Unit 101
- 608 NW 84th St
- 9528 9th Ave NW
- 910 NW 85th St Unit B
- 8757 Palatine Ave N Unit B
- 9017 12th Ave S
- 8729 Palatine Ave N
- 9548 3rd Ave NW
- 9020 13th Ave NW Unit B
- 9029 6th Ave NW
- 9021 6th Ave NW
- 9033 6th Ave NW
- 9017 6th Ave NW
- 9013 6th Ave NW
- 9037 6th Ave NW
- 9024 7th Ave NW
- 9020 7th Ave NW
- 9028 7th Ave NW
- 9041 6th Ave NW
- 9032 7th Ave NW
- 9012 7th Ave NW
- 9009 6th Ave NW
- 9018 7th Ave NW
- 9024 6th Ave NW
- 9036 7th Ave NW
- 9020 6th Ave NW
- 9045 6th Ave NW
- 9014 6th Ave NW
- 9040 7th Ave NW