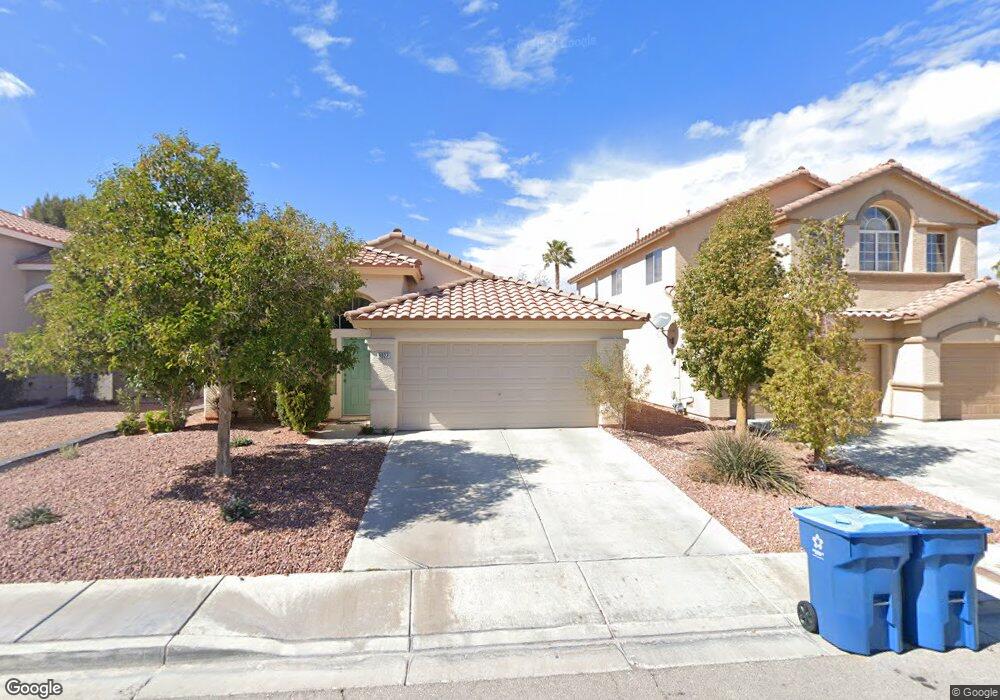
9027 Sandy Slate Way Las Vegas, NV 89123
Silverado Ranch NeighborhoodEstimated Value: $372,000 - $447,000
3
Beds
2
Baths
1,477
Sq Ft
$279/Sq Ft
Est. Value
About This Home
This home is located at 9027 Sandy Slate Way, Las Vegas, NV 89123 and is currently estimated at $412,572, approximately $279 per square foot. 9027 Sandy Slate Way is a home located in Clark County with nearby schools including Roberta C Cartwright Elementary School, Charles Silvestri Junior High School, and Silverado High School.
Ownership History
Date
Name
Owned For
Owner Type
Purchase Details
Closed on
Sep 26, 2025
Sold by
Cando Clarence M and Posis Virginia S
Bought by
Posis Virginia S
Current Estimated Value
Purchase Details
Closed on
Aug 6, 2025
Sold by
Posis Virginia S
Bought by
Virginia S Posis-Cando Revocable Living Trust and Posis
Purchase Details
Closed on
Apr 24, 2013
Sold by
Posis Virginia S
Bought by
Posis Virginia S
Purchase Details
Closed on
Jun 25, 2002
Sold by
Lim Hindley
Bought by
Posis Virginia S
Home Financials for this Owner
Home Financials are based on the most recent Mortgage that was taken out on this home.
Original Mortgage
$120,000
Interest Rate
6.86%
Purchase Details
Closed on
Jul 27, 1999
Sold by
Lim Hindley
Bought by
Posis Virginia S
Purchase Details
Closed on
Jun 11, 1997
Sold by
Pebble Road Two Ltd Partnership
Bought by
Lim Hindley M and Posis Virginia S
Home Financials for this Owner
Home Financials are based on the most recent Mortgage that was taken out on this home.
Original Mortgage
$117,689
Interest Rate
7.98%
Mortgage Type
FHA
Create a Home Valuation Report for This Property
The Home Valuation Report is an in-depth analysis detailing your home's value as well as a comparison with similar homes in the area
Home Values in the Area
Average Home Value in this Area
Purchase History
| Date | Buyer | Sale Price | Title Company |
|---|---|---|---|
| Posis Virginia S | -- | None Listed On Document | |
| Virginia S Posis-Cando Revocable Living Trust | -- | None Listed On Document | |
| Posis Virginia S | -- | None Available | |
| Posis Virginia S | -- | Stewart Title | |
| Posis Virginia S | -- | -- | |
| Lim Hindley M | $119,000 | United Title |
Source: Public Records
Mortgage History
| Date | Status | Borrower | Loan Amount |
|---|---|---|---|
| Previous Owner | Posis Virginia S | $120,000 | |
| Previous Owner | Lim Hindley M | $117,689 |
Source: Public Records
Tax History Compared to Growth
Tax History
| Year | Tax Paid | Tax Assessment Tax Assessment Total Assessment is a certain percentage of the fair market value that is determined by local assessors to be the total taxable value of land and additions on the property. | Land | Improvement |
|---|---|---|---|---|
| 2025 | $1,662 | $88,977 | $35,000 | $53,977 |
| 2024 | $1,614 | $88,977 | $35,000 | $53,977 |
| 2023 | $1,614 | $83,085 | $31,850 | $51,235 |
| 2022 | $1,567 | $73,503 | $26,600 | $46,903 |
| 2021 | $1,521 | $69,198 | $24,500 | $44,698 |
| 2020 | $1,474 | $68,278 | $23,800 | $44,478 |
| 2019 | $1,431 | $63,886 | $19,950 | $43,936 |
| 2018 | $1,389 | $59,059 | $16,800 | $42,259 |
| 2017 | $1,708 | $58,254 | $15,400 | $42,854 |
| 2016 | $1,317 | $53,795 | $10,850 | $42,945 |
| 2015 | $1,313 | $48,433 | $9,800 | $38,633 |
| 2014 | $1,275 | $42,173 | $7,000 | $35,173 |
Source: Public Records
Map
Nearby Homes
- 9076 Quarrystone Way
- 9106 Sandy Slate Way
- 8940 Sandy Slate Way
- 8959 Coral Shale St
- 8996 Union Gap Rd
- 999 Country Skies Ave
- 977 Country Skies Ave
- 8880 Star Valley Ct
- 9239 Sleeping Tree St
- 687 Fontayne Ave
- 1066 Aspen Valley Ave Unit 4B
- 8973 Edgeworth Place
- 8840 Quintane Ln
- 1138 Aspen Valley Ave
- 8777 Shady Peak Way Unit 2
- 8820 Manalang Rd
- 1006 Coldwater Falls Way
- 8698 Waterford Bend St
- 9331 Coral Berry St
- 9338 Coral Berry St Unit 1
- 9015 Sandy Slate Way
- 9039 Sandy Slate Way
- 9003 Sandy Slate Way
- 9024 Quarrystone Way
- 9012 Quarrystone Way
- 9036 Quarrystone Way
- 9000 Quarrystone Way Unit A
- 8975 Sandy Slate Way
- 9063 Sandy Slate Way
- 9048 Quarrystone Way
- 8988 Quarrystone Way
- 9026 Sandy Slate Way
- 9038 Sandy Slate Way
- 9014 Sandy Slate Way
- 9002 Sandy Slate Way
- 9050 Sandy Slate Way
- 9060 Quarrystone Way
- 8976 Quarrystone Way
- 8963 Sandy Slate Way
- 8963 Sandy Slate Way Unit x