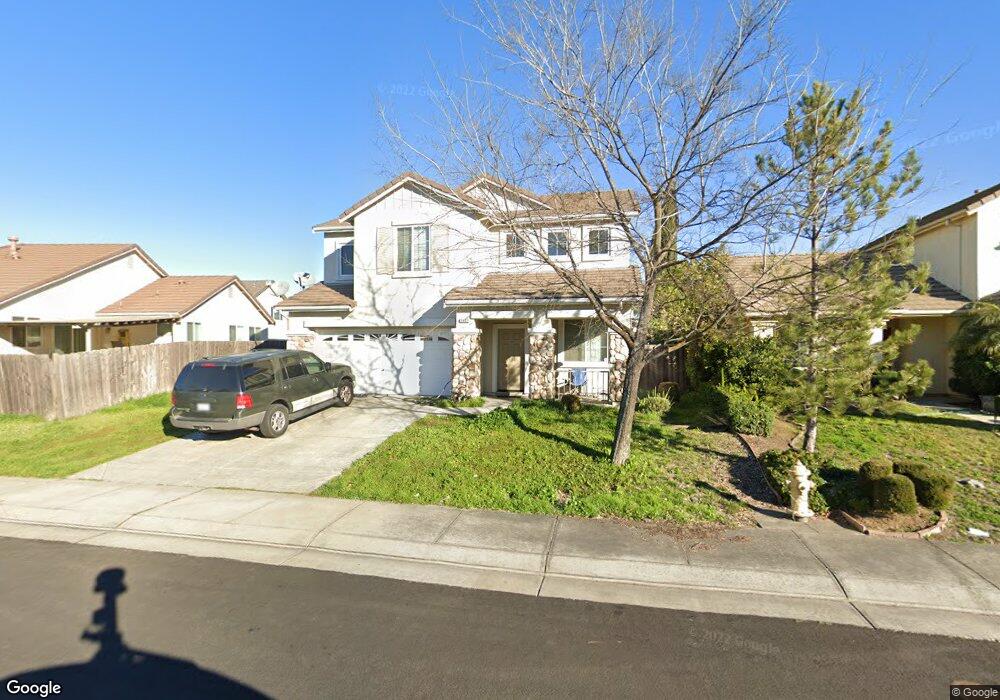
9029 Chianti Cir Stockton, CA 95212
Valley Oak NeighborhoodEstimated Value: $179,000 - $540,000
4
Beds
2
Baths
1,899
Sq Ft
$226/Sq Ft
Est. Value
About This Home
This home is located at 9029 Chianti Cir, Stockton, CA 95212 and is currently estimated at $429,815, approximately $226 per square foot. 9029 Chianti Cir is a home located in San Joaquin County with nearby schools including Ansel Adams School, Morada Middle School, and Ronald E. McNair High School.
Ownership History
Date
Name
Owned For
Owner Type
Purchase Details
Closed on
Jun 6, 2012
Sold by
Larkins Joseph and Wu Olivia
Bought by
Larkins Joseph and Wu Olivia
Current Estimated Value
Purchase Details
Closed on
Jul 7, 2011
Sold by
Fannie Mae
Bought by
Larkins Joseph and Wu Olivia
Home Financials for this Owner
Home Financials are based on the most recent Mortgage that was taken out on this home.
Original Mortgage
$131,625
Outstanding Balance
$90,297
Interest Rate
4.45%
Mortgage Type
New Conventional
Estimated Equity
$339,518
Purchase Details
Closed on
Jan 14, 2011
Sold by
Singh Nasib
Bought by
Federal National Mortgage Association
Purchase Details
Closed on
Dec 3, 2004
Sold by
Stockton Villa Tuscany Lp
Bought by
Singh Nasib
Home Financials for this Owner
Home Financials are based on the most recent Mortgage that was taken out on this home.
Original Mortgage
$252,650
Interest Rate
5.75%
Mortgage Type
Purchase Money Mortgage
Purchase Details
Closed on
Jul 23, 2004
Sold by
Kaur Paramjeet
Bought by
Singh Nasib
Create a Home Valuation Report for This Property
The Home Valuation Report is an in-depth analysis detailing your home's value as well as a comparison with similar homes in the area
Home Values in the Area
Average Home Value in this Area
Purchase History
| Date | Buyer | Sale Price | Title Company |
|---|---|---|---|
| Larkins Joseph | -- | None Available | |
| Larkins Joseph | $175,500 | Old Republic Title Company | |
| Federal National Mortgage Association | $401,055 | None Available | |
| Singh Nasib | $316,000 | Old Republic Title Co | |
| Singh Nasib | -- | Old Republic Title Co |
Source: Public Records
Mortgage History
| Date | Status | Borrower | Loan Amount |
|---|---|---|---|
| Open | Larkins Joseph | $131,625 | |
| Previous Owner | Singh Nasib | $252,650 | |
| Closed | Singh Nasib | $63,150 |
Source: Public Records
Tax History Compared to Growth
Tax History
| Year | Tax Paid | Tax Assessment Tax Assessment Total Assessment is a certain percentage of the fair market value that is determined by local assessors to be the total taxable value of land and additions on the property. | Land | Improvement |
|---|---|---|---|---|
| 2025 | $3,597 | $220,426 | $54,005 | $166,421 |
| 2024 | $3,539 | $216,105 | $52,947 | $163,158 |
| 2023 | $3,479 | $211,868 | $51,909 | $159,959 |
| 2022 | $3,404 | $207,715 | $50,892 | $156,823 |
| 2021 | $3,407 | $203,644 | $49,895 | $153,749 |
| 2020 | $3,440 | $201,557 | $49,384 | $152,173 |
| 2019 | $3,336 | $197,606 | $48,416 | $149,190 |
| 2018 | $3,285 | $193,732 | $47,467 | $146,265 |
| 2017 | $3,199 | $189,935 | $46,537 | $143,398 |
| 2016 | $3,006 | $186,210 | $45,624 | $140,586 |
| 2014 | $3,193 | $179,822 | $44,059 | $135,763 |
Source: Public Records
Map
Nearby Homes
- 9042 Chianti Cir
- 9126 Verdicchio Ct
- 8517 Kenny Ct
- 9516 San Marco Ct
- 9109 Valley Dr
- 3484 Cathedral Cir
- 8061 Shay Cir
- 4520 E Morada Ln
- 8013 Shay Cir
- 4320 Christian Life Way
- 9454 N Highway 99 Unit 9
- 9308 Pioneer Cir
- 9253 Bridalveil Cir
- 9740 Palazzo Dr
- 9484 N Highway 99 Unit 44
- 4817 E Morada Ln
- 7849 Moreland St
- 5115 Hildreth Ln
- 3827 Vecchio Ln
- 4944 Manor Cir
- 9031 Chianti Cir
- 9019 Chianti Cir
- 9017 Chianti Cir
- 4104 Dolcetto Ln
- 9033 Chianti Cir
- 9015 Chianti Cir
- 9009 Soave Ln
- 4118 Dolcetto Ln
- 9028 Chianti Cir
- 9030 Chianti Cir
- 9035 Chianti Cir
- 9026 Chianti Cir
- 9013 Chianti Cir
- 9032 Chianti Cir
- 4132 Dolcetto Ln
- 9024 Chianti Cir
- 9021 Soave Ln
- 9034 Chianti Cir
- 9018 Chianti Cir
- 9039 Chianti Cir