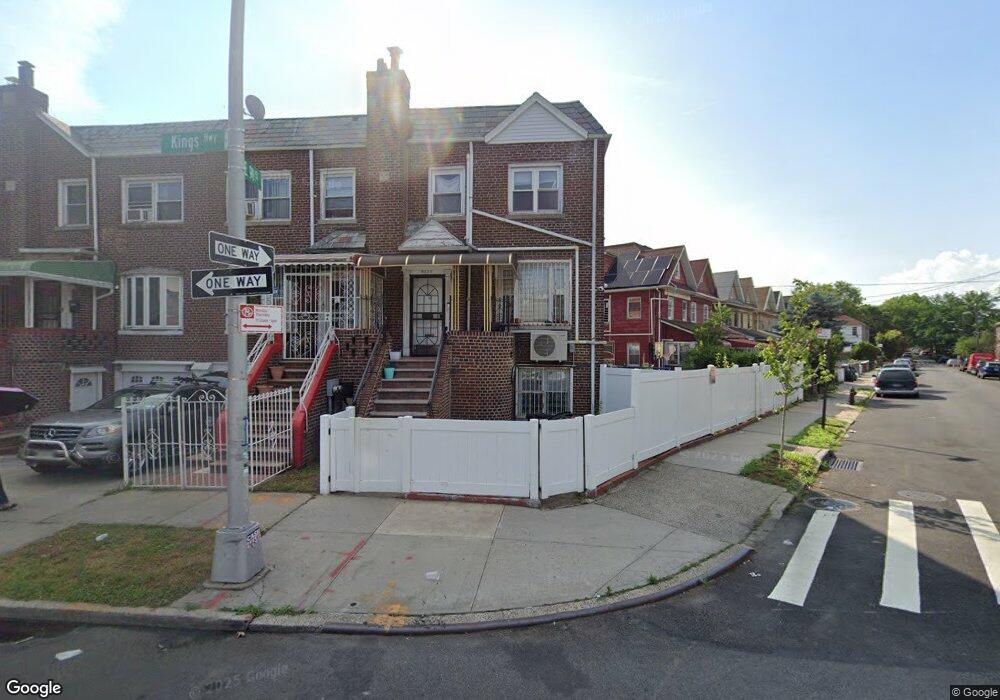
9029 Kings Hwy Unit Building Brooklyn, NY 11212
East Flatbush NeighborhoodEstimated Value: $856,000 - $980,000
--
Bed
2
Baths
2,166
Sq Ft
$417/Sq Ft
Est. Value
About This Home
This home is located at 9029 Kings Hwy Unit Building, Brooklyn, NY 11212 and is currently estimated at $903,991, approximately $417 per square foot. 9029 Kings Hwy Unit Building is a home located in Kings County with nearby schools including P.S. 219 Kennedy King, Middle School For Art And Philosphy, and Kings Elementary School.
Ownership History
Date
Name
Owned For
Owner Type
Purchase Details
Closed on
Nov 28, 2017
Sold by
Grandeline Douglas Living Trust
Bought by
Wircberg Ita and Wircberg Moshe
Current Estimated Value
Home Financials for this Owner
Home Financials are based on the most recent Mortgage that was taken out on this home.
Original Mortgage
$504,000
Outstanding Balance
$423,664
Interest Rate
3.88%
Mortgage Type
Purchase Money Mortgage
Estimated Equity
$480,327
Purchase Details
Closed on
Aug 22, 2011
Sold by
Chin Lorna E and Douglas Grandeline
Bought by
Chin Lorna E and Douglas Grandeline
Create a Home Valuation Report for This Property
The Home Valuation Report is an in-depth analysis detailing your home's value as well as a comparison with similar homes in the area
Home Values in the Area
Average Home Value in this Area
Purchase History
| Date | Buyer | Sale Price | Title Company |
|---|---|---|---|
| Wircberg Ita | $630,000 | -- | |
| Chin Lorna E | -- | -- |
Source: Public Records
Mortgage History
| Date | Status | Borrower | Loan Amount |
|---|---|---|---|
| Open | Wircberg Ita | $504,000 |
Source: Public Records
Tax History Compared to Growth
Tax History
| Year | Tax Paid | Tax Assessment Tax Assessment Total Assessment is a certain percentage of the fair market value that is determined by local assessors to be the total taxable value of land and additions on the property. | Land | Improvement |
|---|---|---|---|---|
| 2025 | $7,187 | $44,940 | $20,040 | $24,900 |
| 2024 | $7,187 | $52,860 | $20,040 | $32,820 |
| 2023 | $6,856 | $51,780 | $20,040 | $31,740 |
| 2022 | $6,358 | $42,360 | $20,040 | $22,320 |
| 2021 | $6,516 | $41,040 | $20,040 | $21,000 |
| 2020 | $3,211 | $39,300 | $20,040 | $19,260 |
| 2019 | $6,238 | $39,300 | $20,040 | $19,260 |
| 2018 | $5,735 | $28,132 | $18,209 | $9,923 |
| 2017 | $4,764 | $26,541 | $16,600 | $9,941 |
| 2016 | $4,537 | $25,800 | $20,040 | $5,760 |
| 2015 | $2,581 | $25,574 | $15,694 | $9,880 |
| 2014 | $2,581 | $24,849 | $15,249 | $9,600 |
Source: Public Records
Map
Nearby Homes