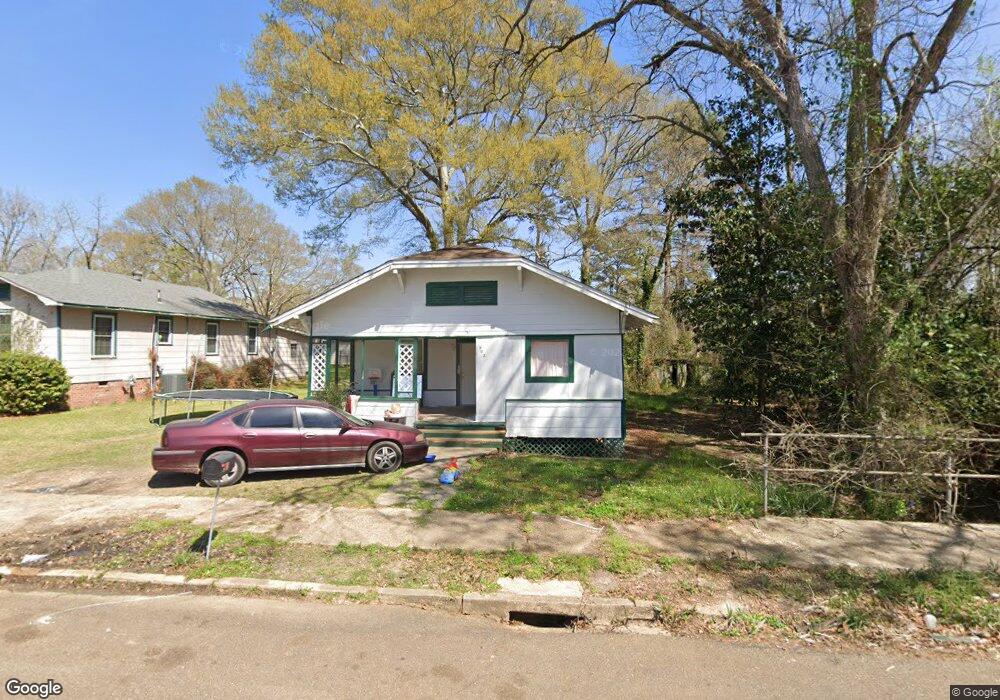
903 3rd St McComb, MS 39648
Estimated Value: $58,717 - $87,000
Studio
--
Bath
1,000
Sq Ft
$74/Sq Ft
Est. Value
About This Home
This home is located at 903 3rd St, McComb, MS 39648 and is currently estimated at $73,929, approximately $73 per square foot. 903 3rd St is a home with nearby schools including Otken Elementary School, Higgins Middle School, and Denman Junior High School.
Ownership History
Date
Name
Owned For
Owner Type
Purchase Details
Closed on
Mar 23, 2020
Sold by
Kelleher Trevour
Bought by
Sterling Investments Llc
Current Estimated Value
Purchase Details
Closed on
Aug 1, 2019
Sold by
Dk Services Llc
Bought by
Sterling Investments Llc
Purchase Details
Closed on
Dec 9, 2012
Sold by
Kelleher Marilyn E
Bought by
Mercury Land Services Llc
Create a Home Valuation Report for This Property
The Home Valuation Report is an in-depth analysis detailing your home's value as well as a comparison with similar homes in the area
Purchase History
| Date | Buyer | Sale Price | Title Company |
|---|---|---|---|
| Sterling Investments Llc | -- | None Available | |
| Sterling Investments Llc | -- | None Available | |
| Mercury Land Services Llc | -- | None Available |
Source: Public Records
Tax History
| Year | Tax Paid | Tax Assessment Tax Assessment Total Assessment is a certain percentage of the fair market value that is determined by local assessors to be the total taxable value of land and additions on the property. | Land | Improvement |
|---|---|---|---|---|
| 2025 | $748 | $4,206 | $0 | $0 |
| 2024 | $644 | $3,604 | $0 | $0 |
| 2023 | $656 | $3,717 | $0 | $0 |
| 2022 | $647 | $3,717 | $0 | $0 |
| 2021 | $645 | $3,717 | $0 | $0 |
| 2020 | $631 | $3,633 | $0 | $0 |
| 2019 | $603 | $3,633 | $0 | $0 |
| 2018 | $586 | $3,633 | $0 | $0 |
| 2017 | $589 | $3,633 | $0 | $0 |
| 2016 | $585 | $3,633 | $0 | $0 |
| 2015 | -- | $3,646 | $0 | $0 |
| 2014 | -- | $3,646 | $0 | $0 |
| 2013 | -- | $1,087 | $0 | $0 |
Source: Public Records
Map
Nearby Homes
Your Personal Tour Guide
Ask me questions while you tour the home.