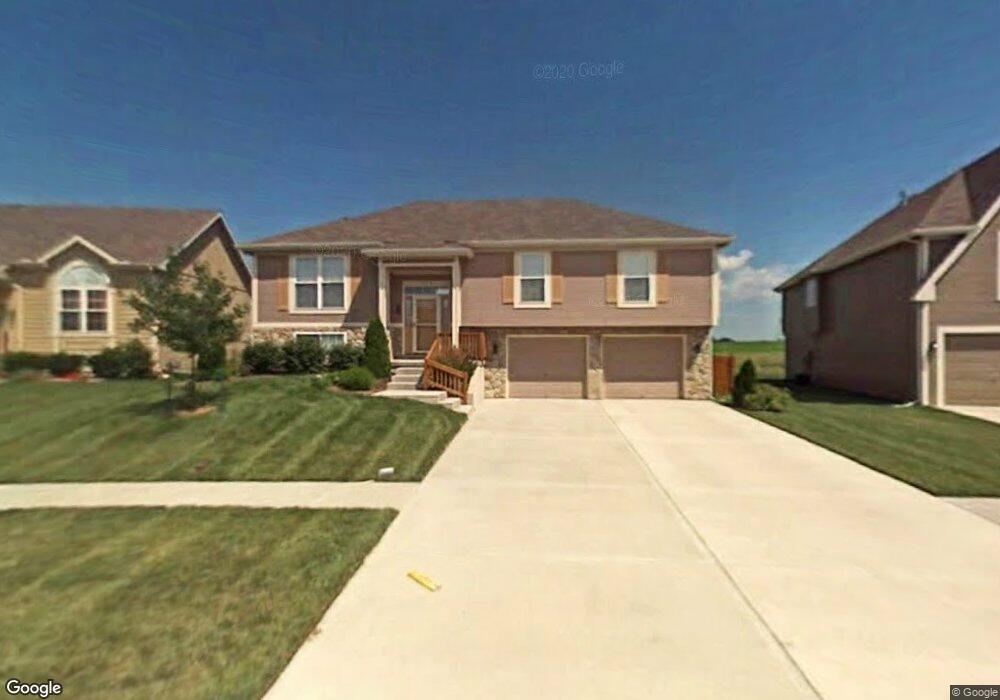
903 Allyssa Ct Lansing, KS 66043
Estimated Value: $339,193 - $379,000
4
Beds
3
Baths
1,484
Sq Ft
$243/Sq Ft
Est. Value
About This Home
This home is located at 903 Allyssa Ct, Lansing, KS 66043 and is currently estimated at $360,548, approximately $242 per square foot. 903 Allyssa Ct is a home located in Leavenworth County with nearby schools including Lansing Elementary School, Lansing Middle 6-8, and Lansing High 9-12.
Ownership History
Date
Name
Owned For
Owner Type
Purchase Details
Closed on
Dec 1, 2004
Bought by
Malave Oscar and Mendoza Glenda
Current Estimated Value
Home Financials for this Owner
Home Financials are based on the most recent Mortgage that was taken out on this home.
Original Mortgage
$167,073
Outstanding Balance
$120,205
Interest Rate
5.72%
Mortgage Type
VA
Estimated Equity
$240,343
Create a Home Valuation Report for This Property
The Home Valuation Report is an in-depth analysis detailing your home's value as well as a comparison with similar homes in the area
Home Values in the Area
Average Home Value in this Area
Purchase History
| Date | Buyer | Sale Price | Title Company |
|---|---|---|---|
| Malave Oscar | $190,000 | -- |
Source: Public Records
Mortgage History
| Date | Status | Borrower | Loan Amount |
|---|---|---|---|
| Open | Malave Oscar | $167,073 |
Source: Public Records
Tax History
| Year | Tax Paid | Tax Assessment Tax Assessment Total Assessment is a certain percentage of the fair market value that is determined by local assessors to be the total taxable value of land and additions on the property. | Land | Improvement |
|---|---|---|---|---|
| 2025 | $4,915 | $38,024 | $5,924 | $32,100 |
| 2024 | $4,563 | $36,561 | $5,924 | $30,637 |
| 2023 | $4,563 | $35,155 | $5,924 | $29,231 |
| 2022 | $4,388 | $31,959 | $3,970 | $27,989 |
| 2021 | $4,208 | $29,233 | $3,970 | $25,263 |
| 2020 | $3,975 | $27,186 | $3,970 | $23,216 |
| 2019 | $3,861 | $26,381 | $3,970 | $22,411 |
| 2018 | $3,432 | $23,495 | $3,970 | $19,525 |
| 2017 | $3,380 | $23,091 | $3,970 | $19,121 |
| 2016 | $3,348 | $22,862 | $3,970 | $18,892 |
| 2015 | $3,338 | $22,862 | $3,970 | $18,892 |
| 2014 | $3,229 | $22,589 | $3,970 | $18,619 |
Source: Public Records
Map
Nearby Homes
- 922 Southfork St
- 811 4-H Rd
- 111 Southfork Rd
- 189 Canyon View Dr
- 875 Clearview Dr
- 522 Forestglen Ln
- 1322 Rock Creek Ct
- 1221 S Desoto Rd
- 898 Clearview Dr
- 202 S Main St
- 26731 147th St
- 124 S Main St
- 218 E Kay St
- 130 Hampton Ct
- 521 Hillbrook Dr
- 13788 McIntyre1 Rd
- 13788 Mcintyre Rd
- 13788 McIntyre2 Rd
- 20958 Ida St
- 24431 139th St
Your Personal Tour Guide
Ask me questions while you tour the home.