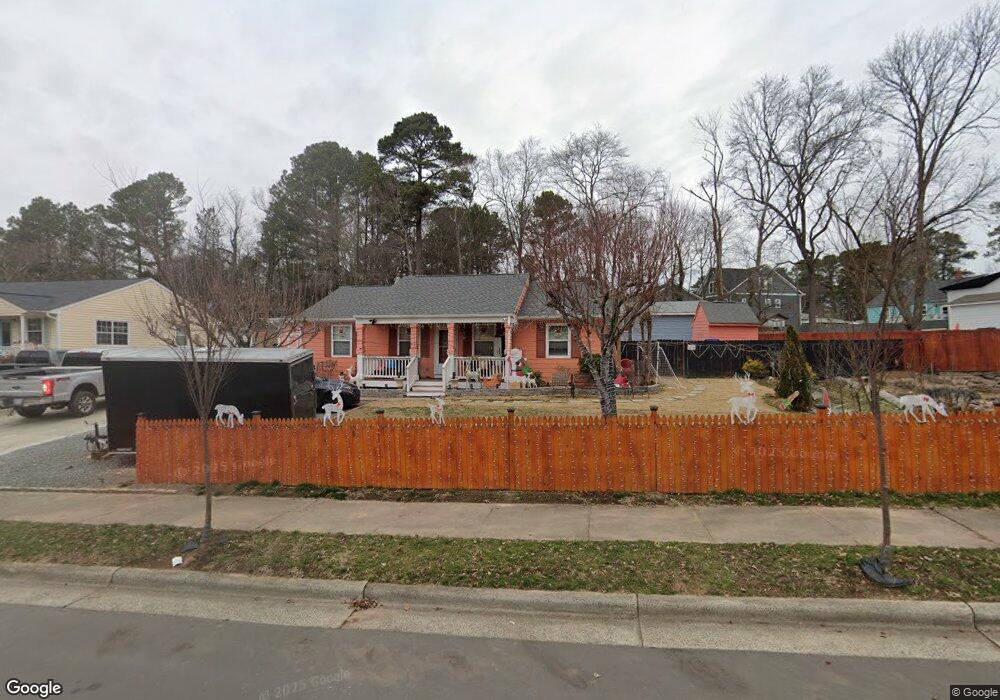
903 Buxton St Durham, NC 27713
Campus Hills NeighborhoodEstimated Value: $295,000 - $312,474
3
Beds
2
Baths
1,300
Sq Ft
$233/Sq Ft
Est. Value
About This Home
This home is located at 903 Buxton St, Durham, NC 27713 and is currently estimated at $303,369, approximately $233 per square foot. 903 Buxton St is a home located in Durham County with nearby schools including Southwest Elementary School, Morehead Montessori, and Sherwood Githens Middle.
Ownership History
Date
Name
Owned For
Owner Type
Purchase Details
Closed on
Dec 23, 2024
Sold by
Argueta Jose
Bought by
Argueta Jose and Argueta Del Cid
Current Estimated Value
Purchase Details
Closed on
Sep 29, 2015
Sold by
Willingham Jennifer
Bought by
Argueta Jose
Home Financials for this Owner
Home Financials are based on the most recent Mortgage that was taken out on this home.
Original Mortgage
$117,800
Interest Rate
3.97%
Mortgage Type
New Conventional
Purchase Details
Closed on
Jul 24, 2008
Sold by
Bank Of New York
Bought by
Willingham Jennifer
Home Financials for this Owner
Home Financials are based on the most recent Mortgage that was taken out on this home.
Original Mortgage
$61,110
Interest Rate
6.21%
Mortgage Type
Purchase Money Mortgage
Purchase Details
Closed on
Feb 15, 2008
Sold by
Stevens Jerome T and Stevens Terry Y
Bought by
Bank Of New York
Create a Home Valuation Report for This Property
The Home Valuation Report is an in-depth analysis detailing your home's value as well as a comparison with similar homes in the area
Home Values in the Area
Average Home Value in this Area
Purchase History
| Date | Buyer | Sale Price | Title Company |
|---|---|---|---|
| Argueta Jose | -- | None Listed On Document | |
| Argueta Jose | -- | None Listed On Document | |
| Argueta Jose | -- | None Listed On Document | |
| Argueta Jose | $124,000 | Attorney | |
| Willingham Jennifer | $68,000 | None Available | |
| Bank Of New York | $95,400 | None Available |
Source: Public Records
Mortgage History
| Date | Status | Borrower | Loan Amount |
|---|---|---|---|
| Previous Owner | Argueta Jose | $117,800 | |
| Previous Owner | Willingham Jennifer | $61,110 |
Source: Public Records
Tax History
| Year | Tax Paid | Tax Assessment Tax Assessment Total Assessment is a certain percentage of the fair market value that is determined by local assessors to be the total taxable value of land and additions on the property. | Land | Improvement |
|---|---|---|---|---|
| 2025 | $3,247 | $327,499 | $155,400 | $172,099 |
| 2024 | $2,351 | $168,543 | $37,755 | $130,788 |
| 2023 | $2,208 | $168,543 | $37,755 | $130,788 |
| 2022 | $2,157 | $168,543 | $37,755 | $130,788 |
| 2021 | $2,147 | $168,543 | $37,755 | $130,788 |
| 2020 | $2,097 | $168,543 | $37,755 | $130,788 |
| 2019 | $2,097 | $168,543 | $37,755 | $130,788 |
| 2018 | $1,846 | $136,103 | $29,365 | $106,738 |
| 2017 | $1,833 | $136,103 | $29,365 | $106,738 |
| 2016 | $1,771 | $136,103 | $29,365 | $106,738 |
| 2015 | $1,618 | $116,851 | $25,000 | $91,851 |
| 2014 | $1,618 | $116,851 | $25,000 | $91,851 |
Source: Public Records
Map
Nearby Homes
- 3908 Booker Ave
- 4008 Booker Ave
- 4020 Fayetteville St
- 7 Hannah Ct
- 1304 Tralea Dr
- 341 Marbella Grove Ct
- 307 Marbella Grove Ct Unit 18
- 1035 Heartstone Way
- 12 Dauphine Place
- 207 Marbella Grove Ct
- 1014 Culloden Cir
- 1208 Willowdale Dr
- 1031 Culloden Cir
- 1012 Akron Ave
- 727 Cook Rd
- 3506 Four Seasons Dr
- 3010 Cedarwood Dr
- 3323 Fayetteville St Unit A
- 3323 Fayetteville St Unit D
- 2317 Curtis St
- 817 Buxton St
- 902 Buxton St
- 3916 Booker Ave
- 813 Buxton St
- 3920 Booker Ave
- 3914 Booker Ave
- 4002 Booker Ave
- 809 Buxton St
- 3906 Booker Ave
- 806 Buxton St
- 3904 Booker Ave
- 4006 Booker Ave
- 805 Buxton St
- 4011 Baker St
- 0 Booker Ave Unit 491281
- 0 Booker Ave Unit 491273
- 4004 Booker Ave
- 0 Booker Ave Unit TR1649623
- 3823 Booker Ave
- 1001 Buxton St
Your Personal Tour Guide
Ask me questions while you tour the home.