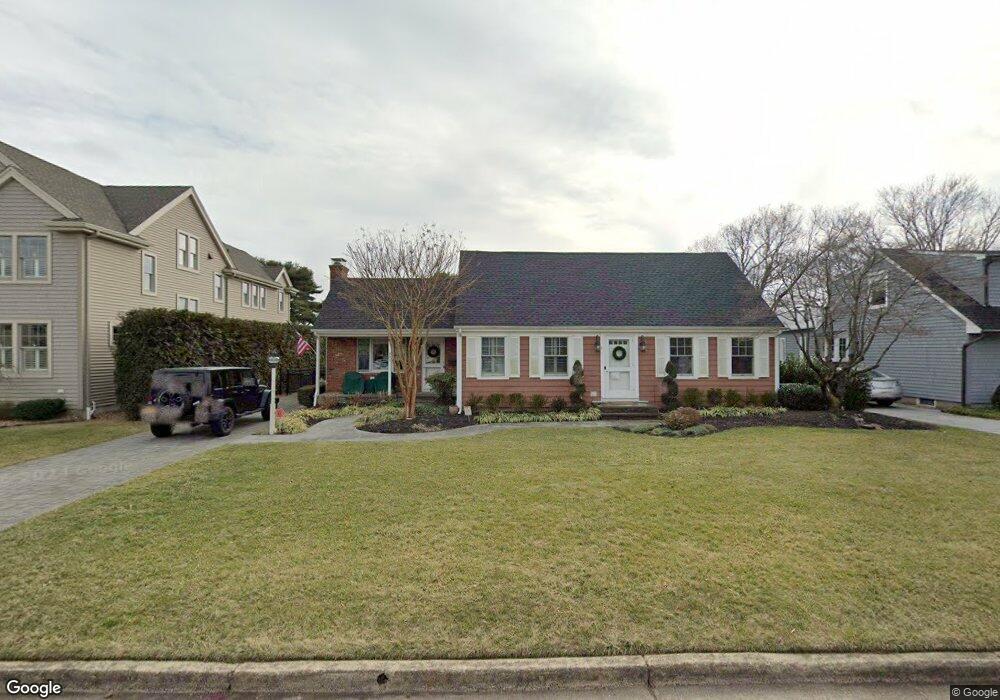
903 Central Ave Spring Lake, NJ 07762
Estimated Value: $1,276,000 - $2,068,000
3
Beds
3
Baths
2,829
Sq Ft
$593/Sq Ft
Est. Value
About This Home
This home is located at 903 Central Ave, Spring Lake, NJ 07762 and is currently estimated at $1,678,151, approximately $593 per square foot. 903 Central Ave is a home located in Monmouth County with nearby schools including Spring Lake Heights Elementary School, St. Catharine School, and The Brookside School.
Ownership History
Date
Name
Owned For
Owner Type
Purchase Details
Closed on
Jun 29, 2010
Sold by
Sepe William R
Bought by
Grier Elizabeth M
Current Estimated Value
Home Financials for this Owner
Home Financials are based on the most recent Mortgage that was taken out on this home.
Original Mortgage
$300,000
Outstanding Balance
$101,088
Interest Rate
4.88%
Mortgage Type
New Conventional
Estimated Equity
$1,577,063
Create a Home Valuation Report for This Property
The Home Valuation Report is an in-depth analysis detailing your home's value as well as a comparison with similar homes in the area
Home Values in the Area
Average Home Value in this Area
Purchase History
| Date | Buyer | Sale Price | Title Company |
|---|---|---|---|
| Grier Elizabeth M | $675,000 | Old Republic National Title |
Source: Public Records
Mortgage History
| Date | Status | Borrower | Loan Amount |
|---|---|---|---|
| Open | Grier Elizabeth M | $300,000 |
Source: Public Records
Tax History
| Year | Tax Paid | Tax Assessment Tax Assessment Total Assessment is a certain percentage of the fair market value that is determined by local assessors to be the total taxable value of land and additions on the property. | Land | Improvement |
|---|---|---|---|---|
| 2025 | $11,251 | $1,151,000 | $736,300 | $414,700 |
| 2024 | $10,665 | $1,068,500 | $661,400 | $407,100 |
| 2023 | $10,665 | $952,200 | $563,800 | $388,400 |
| 2022 | $10,765 | $894,200 | $410,300 | $483,900 |
| 2021 | $10,765 | $797,400 | $357,500 | $439,900 |
| 2020 | $9,979 | $734,800 | $335,500 | $399,300 |
| 2019 | $9,926 | $723,500 | $335,500 | $388,000 |
| 2018 | $9,788 | $694,200 | $335,500 | $358,700 |
| 2017 | $9,380 | $689,700 | $335,500 | $354,200 |
| 2016 | $9,314 | $676,400 | $335,500 | $340,900 |
| 2015 | $9,166 | $667,600 | $335,500 | $332,100 |
| 2014 | $8,641 | $643,400 | $313,500 | $329,900 |
Source: Public Records
Map
Nearby Homes
- 909 Jersey Ave
- 574 Central Ave
- 607 Central Ave
- 570 Central Ave
- 2127 Locust Rd
- 304 8th Ave
- 604 Monmouth Ave
- 708 New York Blvd
- 510 Beacon Blvd
- 612 Brooklyn Blvd
- 27 Apple Dr
- 722 Boston Blvd
- 1304 W Magnolia Ave
- 513 Mercer Ave
- 43 Old Squan Rd
- 2005 Nassau Dr
- 703 Sea Girt Ave
- 16 Cherry Ct
- 208 Salem Ave
- 507 Crescent Pkwy
Your Personal Tour Guide
Ask me questions while you tour the home.