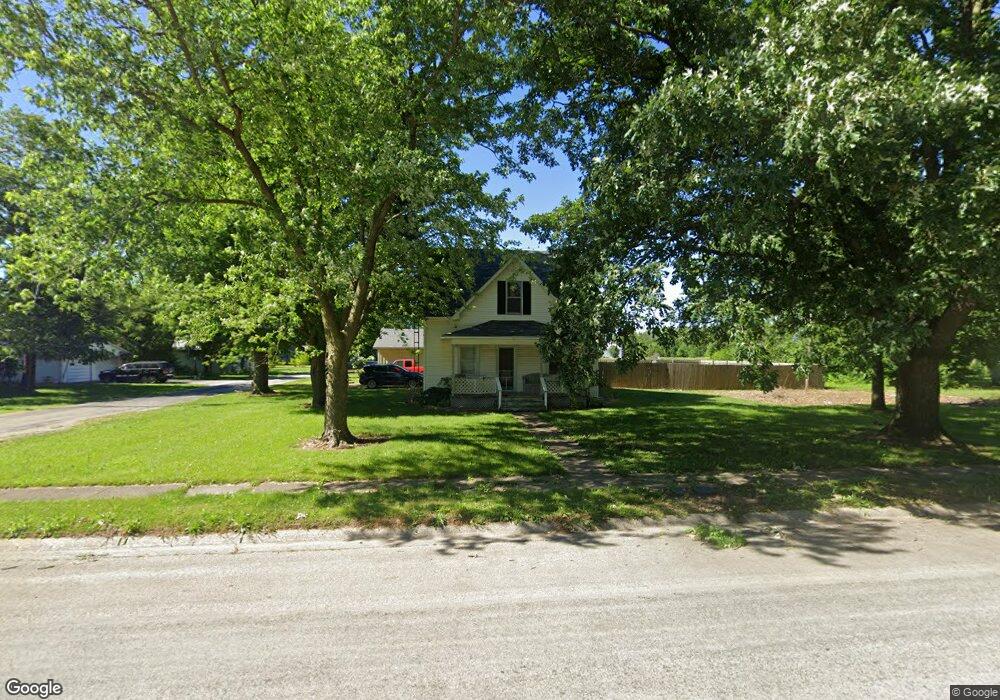
903 E Union St Nokomis, IL 62075
Estimated Value: $55,745 - $75,000
2
Beds
1
Bath
897
Sq Ft
$70/Sq Ft
Est. Value
About This Home
This home is located at 903 E Union St, Nokomis, IL 62075 and is currently estimated at $62,936, approximately $70 per square foot. 903 E Union St is a home located in Montgomery County with nearby schools including North Elementary School, Nokomis Junior/Senior High School, and St. Louis Catholic School.
Ownership History
Date
Name
Owned For
Owner Type
Purchase Details
Closed on
Jul 7, 2014
Sold by
Security National Bank
Bought by
Rench Eric H and Rench Tonya A
Current Estimated Value
Home Financials for this Owner
Home Financials are based on the most recent Mortgage that was taken out on this home.
Original Mortgage
$16,000
Outstanding Balance
$11,758
Interest Rate
3.25%
Mortgage Type
New Conventional
Estimated Equity
$51,178
Purchase Details
Closed on
Nov 27, 2013
Sold by
Bussell Russell Leroy
Bought by
Security National Bank
Purchase Details
Closed on
Aug 10, 2012
Sold by
Pavolko Brown Lea A
Bought by
Brown Russell L
Purchase Details
Closed on
Oct 1, 2008
Sold by
Security National Bank
Bought by
Brown Russell Leroy and Brown Leann Pavolka
Home Financials for this Owner
Home Financials are based on the most recent Mortgage that was taken out on this home.
Original Mortgage
$30,000
Interest Rate
6.52%
Mortgage Type
Seller Take Back
Purchase Details
Closed on
Jun 4, 2008
Sold by
Schroedel Patricia Ann
Bought by
Security National Bank
Create a Home Valuation Report for This Property
The Home Valuation Report is an in-depth analysis detailing your home's value as well as a comparison with similar homes in the area
Purchase History
| Date | Buyer | Sale Price | Title Company |
|---|---|---|---|
| Rench Eric H | $18,000 | -- | |
| Security National Bank | -- | -- | |
| Brown Russell L | -- | None Available | |
| Brown Russell Leroy | $30,000 | None Available | |
| Security National Bank | -- | None Available |
Source: Public Records
Mortgage History
| Date | Status | Borrower | Loan Amount |
|---|---|---|---|
| Open | Rench Eric H | $16,000 | |
| Previous Owner | Brown Russell Leroy | $30,000 |
Source: Public Records
Tax History
| Year | Tax Paid | Tax Assessment Tax Assessment Total Assessment is a certain percentage of the fair market value that is determined by local assessors to be the total taxable value of land and additions on the property. | Land | Improvement |
|---|---|---|---|---|
| 2024 | $550 | $11,600 | $2,100 | $9,500 |
| 2023 | $555 | $10,880 | $1,970 | $8,910 |
| 2022 | $567 | $10,450 | $1,890 | $8,560 |
| 2021 | $559 | $10,920 | $1,970 | $8,950 |
| 2020 | $563 | $10,410 | $1,880 | $8,530 |
| 2019 | $559 | $10,990 | $1,980 | $9,010 |
| 2018 | $577 | $10,340 | $1,860 | $8,480 |
| 2017 | $607 | $9,720 | $1,750 | $7,970 |
| 2016 | $616 | $9,450 | $1,700 | $7,750 |
| 2015 | $943 | $9,160 | $1,650 | $7,510 |
| 2013 | -- | $15,580 | $1,670 | $13,910 |
Source: Public Records
Map
Nearby Homes
- 900 E Union St
- 101 W South St
- 115 W South St
- 600 Sanford Ave
- 304 N Spruce St
- 507 N Spruce St
- 318 N Cedar St
- 602 Herman St
- 416 Griffin St
- 245 S 7th St
- 185 Montgomery St
- Three Miles South of Nokomis
- 843 Monroe St
- 210 E Raymon Ave
- 638 E Ford Ave
- 529 N 2nd St
- 207 N 1st St
- 111 W Middleton St
- 104 N 6th St
- 17095 N 17th Ave
Your Personal Tour Guide
Ask me questions while you tour the home.