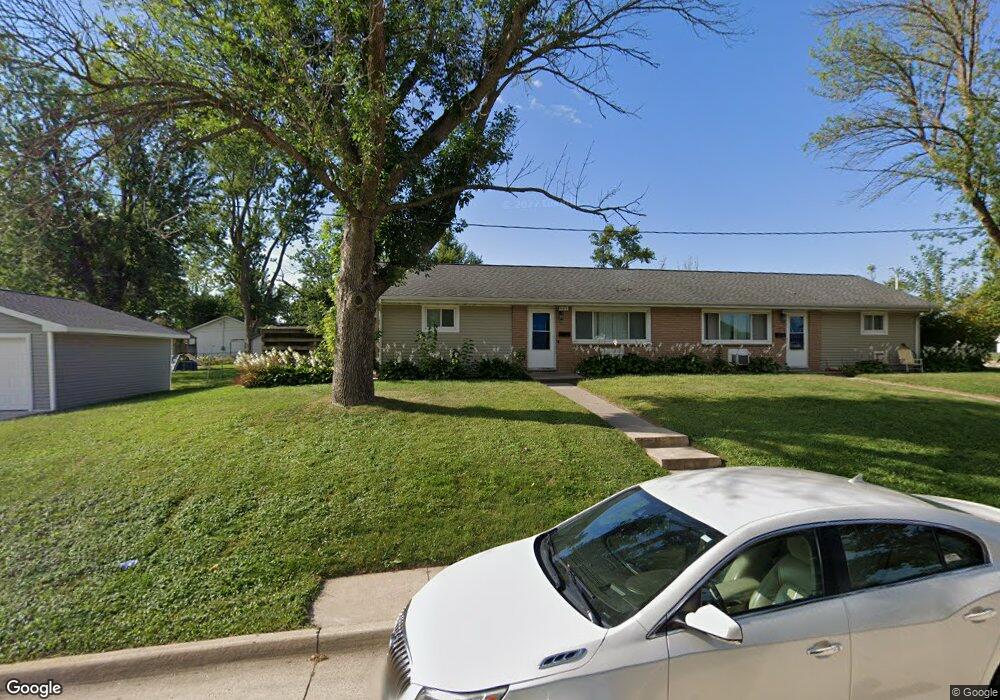
903 Heefner St Hiawatha, IA 52233
Estimated Value: $213,423 - $241,000
4
Beds
2
Baths
1,680
Sq Ft
$136/Sq Ft
Est. Value
About This Home
This home is located at 903 Heefner St, Hiawatha, IA 52233 and is currently estimated at $227,856, approximately $135 per square foot. 903 Heefner St is a home located in Linn County with nearby schools including Hiawatha Elementary School, Ponderosa Elementary School, and Bowling Green Learning Center.
Ownership History
Date
Name
Owned For
Owner Type
Purchase Details
Closed on
Jun 6, 2024
Sold by
Upper Level Properties Llc
Bought by
Nunemaker Benjamin
Current Estimated Value
Home Financials for this Owner
Home Financials are based on the most recent Mortgage that was taken out on this home.
Original Mortgage
$213,750
Outstanding Balance
$211,100
Interest Rate
7.17%
Mortgage Type
New Conventional
Estimated Equity
$16,756
Purchase Details
Closed on
Nov 20, 2019
Sold by
Dpn Investments Llc
Bought by
Upper Level Properties Llc
Home Financials for this Owner
Home Financials are based on the most recent Mortgage that was taken out on this home.
Original Mortgage
$165,600
Interest Rate
3.6%
Mortgage Type
Credit Line Revolving
Purchase Details
Closed on
Apr 24, 2017
Sold by
Wrob Llc
Bought by
Dpn Investments Llc
Purchase Details
Closed on
Dec 11, 2015
Sold by
Terry Timothy F and Rice Gretchen M
Bought by
Terry Timothy F and Terry Family Revocable Trust
Create a Home Valuation Report for This Property
The Home Valuation Report is an in-depth analysis detailing your home's value as well as a comparison with similar homes in the area
Home Values in the Area
Average Home Value in this Area
Purchase History
| Date | Buyer | Sale Price | Title Company |
|---|---|---|---|
| Nunemaker Benjamin | $225,000 | None Listed On Document | |
| Upper Level Properties Llc | $160,000 | None Available | |
| Dpn Investments Llc | $130,000 | None Available | |
| Wrob Llc | $119,000 | None Available | |
| Terry Timothy F | -- | None Available |
Source: Public Records
Mortgage History
| Date | Status | Borrower | Loan Amount |
|---|---|---|---|
| Open | Nunemaker Benjamin | $213,750 | |
| Previous Owner | Upper Level Properties Llc | $165,600 |
Source: Public Records
Tax History Compared to Growth
Tax History
| Year | Tax Paid | Tax Assessment Tax Assessment Total Assessment is a certain percentage of the fair market value that is determined by local assessors to be the total taxable value of land and additions on the property. | Land | Improvement |
|---|---|---|---|---|
| 2025 | $3,048 | $222,600 | $21,900 | $200,700 |
| 2024 | $2,686 | $185,400 | $21,900 | $163,500 |
| 2023 | $2,686 | $185,400 | $21,900 | $163,500 |
| 2022 | $2,654 | $132,500 | $21,900 | $110,600 |
| 2021 | $3,016 | $132,500 | $21,900 | $110,600 |
| 2020 | $3,016 | $117,500 | $21,900 | $95,600 |
| 2019 | $2,328 | $109,200 | $21,900 | $87,300 |
| 2018 | $2,288 | $109,200 | $21,900 | $87,300 |
| 2017 | $2,258 | $103,200 | $21,900 | $81,300 |
| 2016 | $2,056 | $96,300 | $21,900 | $74,400 |
| 2015 | $2,056 | $96,300 | $21,900 | $74,400 |
| 2014 | $2,062 | $96,400 | $22,000 | $74,400 |
| 2013 | $2,010 | $96,400 | $22,000 | $74,400 |
Source: Public Records
Map
Nearby Homes
- 306 10th Ave
- 1213 Bowler St
- 1213 Raney St
- 5455 Blairs Ferry Rd NE
- 3 N Center Point Rd
- 1 N Center Point Rd
- 2602 Towne House Dr NE
- 1364 Cress Pkwy
- 4761 Westchester Dr NE Unit C
- 4745 Westchester Dr NE Unit A
- 3620 Western Pine Dr NE
- 109 E Willman St
- 4642 Aspen Ln NE
- 2596 Anne Ln
- 4609 White Pine Dr NE
- 4545 Westchester Dr NE Unit D
- 3719 Blue Mound Dr NE
- 4460 Westchester Dr NE Unit C
- 114 Northwood Dr
- 4433 Coventry Ln NE