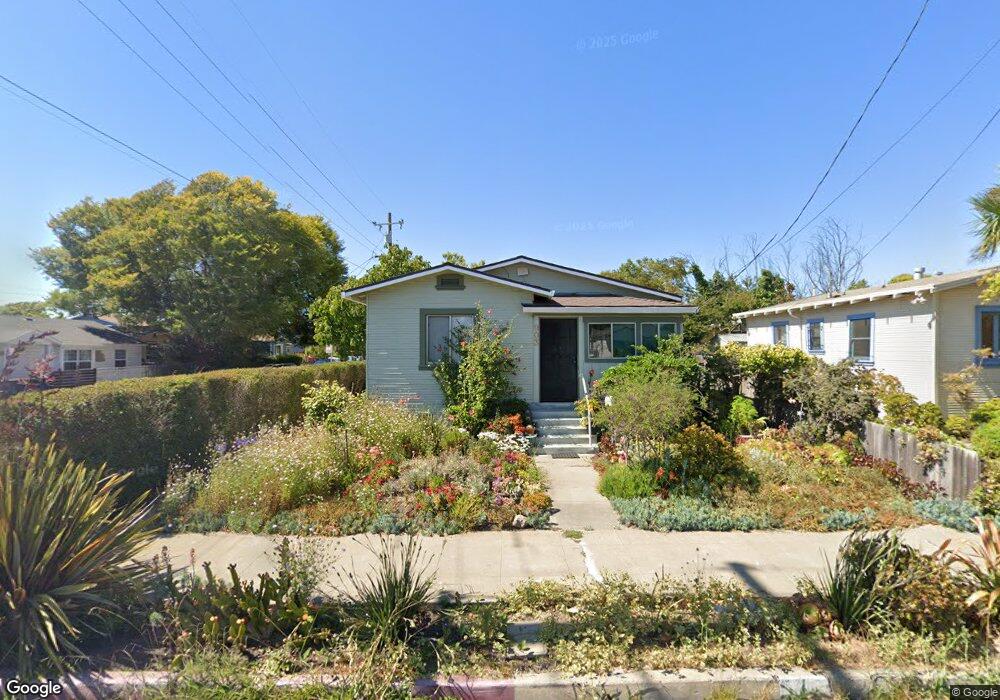
903 Jones St Berkeley, CA 94710
West Berkeley NeighborhoodEstimated Value: $746,264 - $1,015,000
1
Bed
1
Bath
772
Sq Ft
$1,130/Sq Ft
Est. Value
About This Home
This home is located at 903 Jones St, Berkeley, CA 94710 and is currently estimated at $872,316, approximately $1,129 per square foot. 903 Jones St is a home located in Alameda County with nearby schools including Rosa Parks Elementary School, Ruth Acty Elementary, and Berkeley Arts Magnet at Whittier School.
Ownership History
Date
Name
Owned For
Owner Type
Purchase Details
Closed on
May 31, 2018
Sold by
Smith Rick J and Moyer Trust
Bought by
Smith Rick J
Current Estimated Value
Purchase Details
Closed on
Nov 17, 2011
Sold by
Moyer Patty Smith and Moyer Trust
Bought by
Moyer Patty Smith and Smith Rick J
Purchase Details
Closed on
Mar 11, 1994
Sold by
Moyer William W and Moyer Patty Smith
Bought by
Moyer William W and Moyer Patty Smith
Create a Home Valuation Report for This Property
The Home Valuation Report is an in-depth analysis detailing your home's value as well as a comparison with similar homes in the area
Home Values in the Area
Average Home Value in this Area
Purchase History
| Date | Buyer | Sale Price | Title Company |
|---|---|---|---|
| Smith Rick J | -- | None Available | |
| Moyer Patty Smith | -- | None Available | |
| Moyer William W | -- | -- |
Source: Public Records
Tax History
| Year | Tax Paid | Tax Assessment Tax Assessment Total Assessment is a certain percentage of the fair market value that is determined by local assessors to be the total taxable value of land and additions on the property. | Land | Improvement |
|---|---|---|---|---|
| 2025 | $3,528 | $92,812 | $54,814 | $44,998 |
| 2024 | $3,528 | $90,855 | $53,739 | $44,116 |
| 2023 | $3,373 | $95,937 | $52,686 | $43,251 |
| 2022 | $3,209 | $87,056 | $51,653 | $42,403 |
| 2021 | $3,186 | $85,211 | $50,640 | $41,571 |
| 2020 | $2,958 | $91,266 | $50,121 | $41,145 |
| 2019 | $2,768 | $89,477 | $49,138 | $40,339 |
| 2018 | $2,710 | $87,723 | $48,175 | $39,548 |
| 2017 | $2,743 | $86,003 | $47,230 | $38,773 |
| 2016 | $2,589 | $84,317 | $46,305 | $38,012 |
| 2015 | $2,538 | $83,051 | $45,609 | $37,442 |
| 2014 | $2,486 | $81,424 | $44,716 | $36,708 |
Source: Public Records
Map
Nearby Homes
- 921 Jones St
- 817 Jones St
- 1504 10th St
- 1450 Fourth St Unit 5
- 1406 San Pablo Ave Unit A
- 998 Virginia St
- 1447 Kains Ave
- 0 Camelia St Unit 41104882
- 1609 Kains Ave
- 817 Delaware St
- 1450 Curtis St
- 1213 San Pablo Ave
- 1128 Delaware St
- 1728 Curtis St
- 1207 Francisco St
- 1207 Francisco St Unit 2
- 1322 Virginia St
- 1919 Curtis St
- 1127 Key Route Blvd
- 1050 Allston Way
Your Personal Tour Guide
Ask me questions while you tour the home.