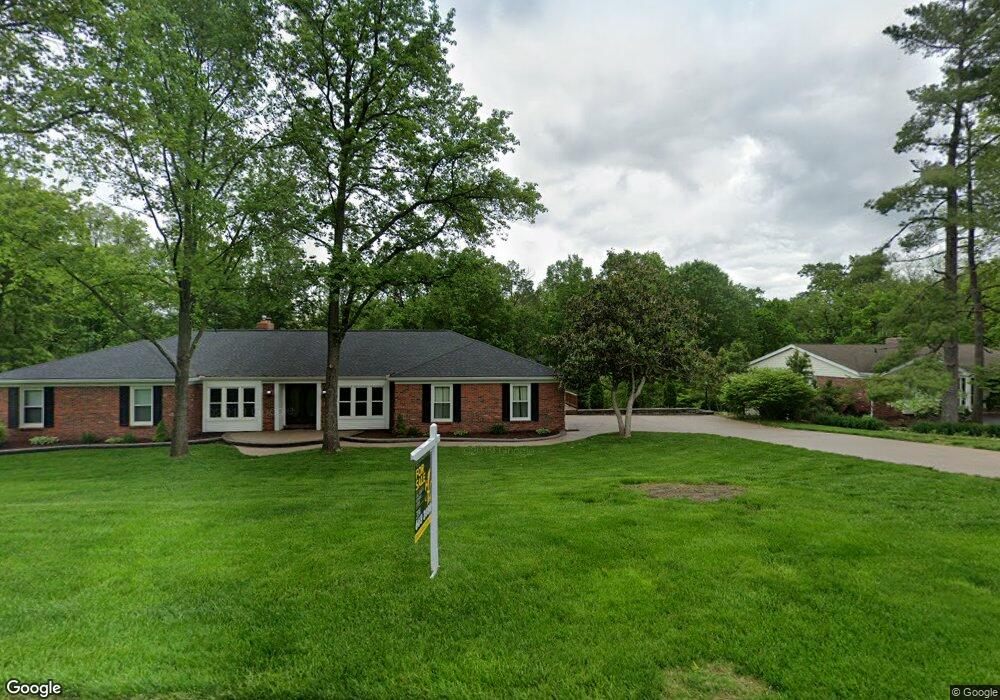
903 Latigos Uc Trail Des Peres, MO 63131
Estimated Value: $777,000 - $817,694
3
Beds
4
Baths
2,859
Sq Ft
$278/Sq Ft
Est. Value
About This Home
This home is located at 903 Latigos Uc Trail, Des Peres, MO 63131 and is currently estimated at $794,924, approximately $278 per square foot. 903 Latigos Uc Trail is a home located in St. Louis County with nearby schools including Barretts Elementary School, Parkway South Middle School, and Parkway South High School.
Ownership History
Date
Name
Owned For
Owner Type
Purchase Details
Closed on
Jul 3, 2019
Sold by
Damle Aneel and Damle Rachelle
Bought by
Wenig Nadine M
Current Estimated Value
Purchase Details
Closed on
Feb 2, 2018
Sold by
Hughes Bryan E and Hughes Christy M
Bought by
Damle Rachelle and Damle Aneel
Home Financials for this Owner
Home Financials are based on the most recent Mortgage that was taken out on this home.
Original Mortgage
$423,200
Interest Rate
3.99%
Mortgage Type
New Conventional
Purchase Details
Closed on
May 26, 2015
Sold by
Pentrex Development Corporation
Bought by
Hughes Bryan E and Hughes Christy M
Home Financials for this Owner
Home Financials are based on the most recent Mortgage that was taken out on this home.
Original Mortgage
$413,246
Interest Rate
3.71%
Mortgage Type
New Conventional
Create a Home Valuation Report for This Property
The Home Valuation Report is an in-depth analysis detailing your home's value as well as a comparison with similar homes in the area
Home Values in the Area
Average Home Value in this Area
Purchase History
| Date | Buyer | Sale Price | Title Company |
|---|---|---|---|
| Wenig Nadine M | $536,000 | Investors Title Company | |
| Damle Rachelle | $529,000 | Investors Title Co Clayton | |
| Hughes Bryan E | -- | Investors Title Co Clayton |
Source: Public Records
Mortgage History
| Date | Status | Borrower | Loan Amount |
|---|---|---|---|
| Previous Owner | Damle Rachelle | $423,200 | |
| Previous Owner | Hughes Bryan E | $413,246 |
Source: Public Records
Tax History Compared to Growth
Tax History
| Year | Tax Paid | Tax Assessment Tax Assessment Total Assessment is a certain percentage of the fair market value that is determined by local assessors to be the total taxable value of land and additions on the property. | Land | Improvement |
|---|---|---|---|---|
| 2025 | $6,890 | $152,110 | $51,110 | $101,000 |
| 2024 | $6,890 | $122,820 | $35,380 | $87,440 |
| 2023 | $6,790 | $122,820 | $35,380 | $87,440 |
| 2022 | $6,108 | $100,360 | $34,030 | $66,330 |
| 2021 | $6,058 | $100,360 | $34,030 | $66,330 |
| 2020 | $5,825 | $92,260 | $27,110 | $65,150 |
| 2019 | $5,744 | $92,260 | $27,110 | $65,150 |
| 2018 | $6,323 | $93,930 | $23,290 | $70,640 |
| 2017 | $6,237 | $93,930 | $23,290 | $70,640 |
| 2016 | $5,881 | $84,170 | $14,670 | $69,500 |
| 2015 | $1,075 | $14,670 | $14,670 | $0 |
| 2014 | $631 | $9,350 | $9,350 | $0 |
Source: Public Records
Map
Nearby Homes
- 2211 Viewroyal Dr
- 2300 E Royal Ct
- 13385 Hiddendale Ln Unit 93
- 2376 Hiddengarden Ct Unit 75
- 12841 Thornhill Ct
- 1824 Topping Rd
- 785 N Ballas Rd
- 2145 Trailcrest Dr
- 12321 Ballas Estates Dr
- 918 N Ballas Rd
- 2037 Trailcrest Ln Unit 7
- 698 Trailcrest Ct Unit 5
- 12827 Huntercreek Rd
- 13112 Thornhill Dr
- 2583 Barrett Place Dr
- 2033 Woodland Knoll
- 2025 Woodland Knoll
- 2017 Woodland Knoll
- 2005 Woodland Knoll
- 2002 Woodland Knoll
- 903 Latigos Trail
- 903UC Latigos Trail
- 911 Latigos Trail
- 869 Plymouth Rock Dr
- 904 Dontaos Dr
- 900 Latigos Trail
- 868 Plymouth Rock Dr
- 863 Plymouth Rock Dr
- 916 Dontaos Dr
- 868 Minarca Dr
- 917 Latigos Trail
- 912 Latigos Trail
- 862 Minarca Dr
- 905 Dontaos Dr
- 862 Plymouth Rock Dr
- 922 Dontaos Dr
- 918 Latigos Trail
- 857 Plymouth Rock Dr
- 925 Latigos Trail
- 12891 White Rock Ct