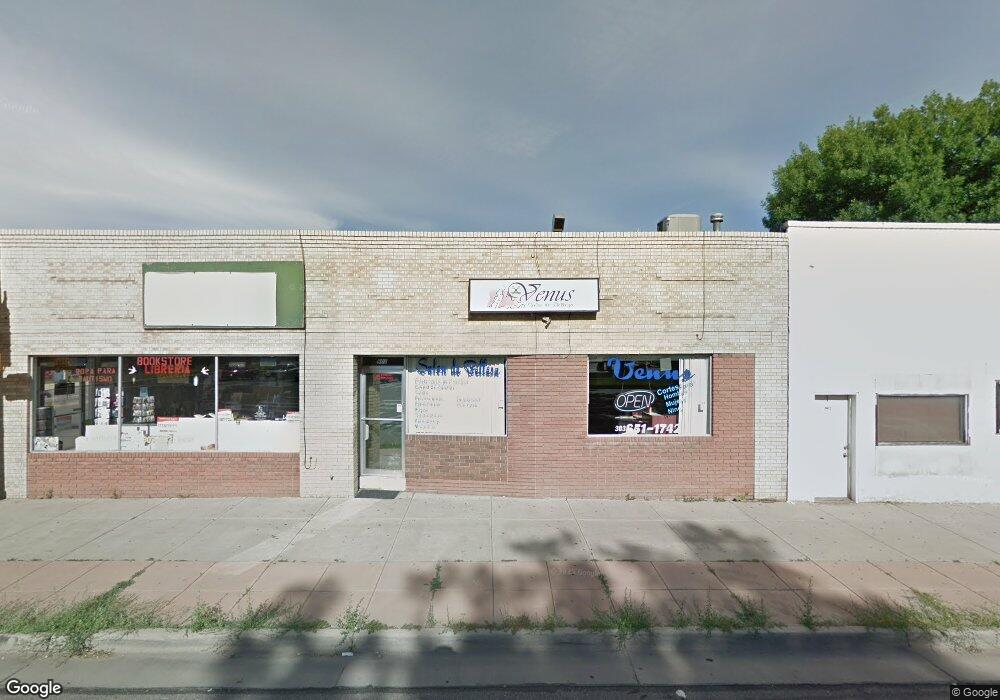
NOT LISTED FOR SALE

Estimated Value: $667,000

-- Bed
-- Bath
13,337 Sq Ft
$50/Sq Ft Est. Value

About This Home

This home is located at 903 Main St, Longmont, CO 80501 and is currently priced at $667,000, approximately $50 per square foot. 903 Main St is a home located in Boulder County with nearby schools including Mountain View Elementary School, Longs Peak Middle School, and Longmont High School.

Ownership History

Date Name Owned For Owner Type

Purchase Details

Closed on
Mar 16, 2022
Sold by
Jsy Properties Llc
Bought by
Casa Lou Llc
Current Estimated Value
$667,000

Purchase Details

Closed on
Jan 13, 2021
Sold by
Brennan Thomas E
Bought by
Jsy Properties Llc

Purchase Details

Closed on
Jan 1, 2005
Sold by
Conway Brennan Mildred and Conway Brennan Mildred
Bought by
Brennan Thomas E

Purchase Details

Closed on
Sep 30, 1997
Sold by
Hank Judy Yeager Living Trust and Henry J
Bought by
Brennan Mildred

Home Financials for this Owner

Home Financials are based on the most recent Mortgage that was taken out on this home.
Original Mortgage
$30,484
Interest Rate
10%
Mortgage Type
Commercial

Purchase Details

Closed on
Aug 9, 1993
Bought by
Brennan Thomas E

Purchase Details

Closed on
Mar 26, 1990
Bought by
Brennan Thomas E

Purchase Details

Closed on
Jun 21, 1978
Bought by
Brennan Thomas E
Source: Public Records

Range of Values:

Collateral Analytics

Collateral Analytics Collateral Analytics AVMs (Automated Valuation Model) employ a number of statistical approaches combined with neighborhood-specific comparable selection guarantees the most up-to-date and precise valuations.

Not Available

Collateral Analytics does not have data for the current month. Please view the chart for historical values.

ICE

ICE Mortgage Technology ICE Mortgage Technology’s AVM (Automated Valuation Model) is a state-of-the-art online residential property valuation tool that provides a quick and accurate estimate of the value of almost any home in the U.S.

Not Available

ICE Mortgage Technology does not have data for the current month. Please view the chart for historical values.

First American

First American First American Data & Analytics’ next-generation AVM combines unrivaled data assets with a blended ensemble of valuation models to produce highly accurate, reliable valuations you can trust.

Not Available

First American does not have data for the current month. Please view the chart for historical values.

Quantarium

Quantarium Quantarium’s valuation service, repeatedly proven the industry’s most accurate and comprehensive, is supercharged with a self-learning and auto-tuning AI engine that continually becomes smarter and more accurate as it processes daily inputs from the industry’s leading RE data lake.

Not Available

Quantarium does not have data for the current month. Please view the chart for historical values.

Average Value
Not Available
List Price
Sold Price
Create a Home Valuation Report for This Property
The Home Valuation Report is an in-depth analysis detailing your home's value as well as a comparison with similar homes in the area

Home Values in the Area

Source: Public Records

Average Home Value in this Area


Source: Public Records

Purchase History

Date Buyer Sale Price Title Company
Casa Lou Llc $280,000 None Listed On Document
Jsy Properties Llc $375,000 Land Title Guarantee Co
Brennan Thomas E -- --
Brennan Mildred $100,000 --
Brennan Thomas E -- --
Source: Public Records

Mortgage History

Date Status Borrower Loan Amount
Previous Owner Brennan Mildred $30,484
Source: Public Records

Tax History Compared to Growth

Source: Public Records

Tax History

Year Tax Paid Tax Assessment Tax Assessment Total Assessment is a certain percentage of the fair market value that is determined by local assessors to be the total taxable value of land and additions on the property. Land Improvement
2023 $7,886 $206,855 $206,855 --
2022 $7,886 $79,692 $43,790 $35,902
2021 $7,765 $79,692 $43,790 $35,902
2020 $7,719 $79,460 $43,790 $35,670
2019 $7,597 $79,460 $43,790 $35,670
2018 $5,692 $59,926 $30,189 $29,737
2017 $5,615 $59,926 $30,189 $29,737
2016 $5,246 $54,880 $13,720 $41,160
2015 $4,999 $45,733 $21,750 $23,983
2014 $4,272 $45,733 $21,750 $23,983
Source: Public Records

Map