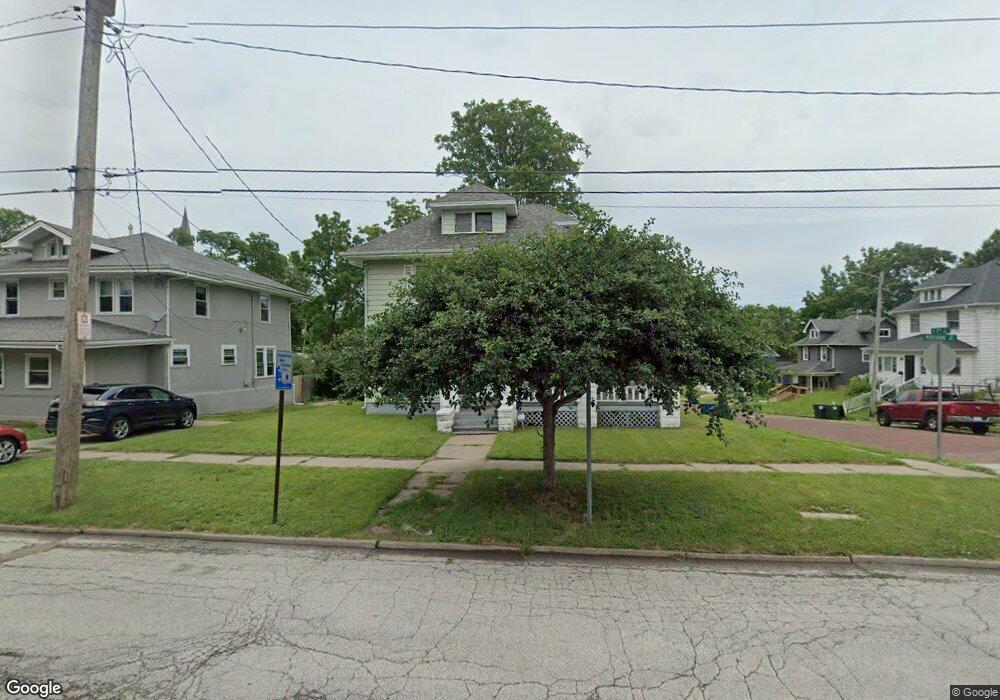
903 Pershing Ave Davenport, IA 52803
Central Davenport NeighborhoodEstimated Value: $110,000 - $129,605
3
Beds
3
Baths
1,844
Sq Ft
$65/Sq Ft
Est. Value
About This Home
This home is located at 903 Pershing Ave, Davenport, IA 52803 and is currently estimated at $120,651, approximately $65 per square foot. 903 Pershing Ave is a home located in Scott County with nearby schools including Walnut Hill Elementary School, Crofton Elementary School, and Casey County Middle School.
Ownership History
Date
Name
Owned For
Owner Type
Purchase Details
Closed on
Mar 4, 2010
Sold by
Style Development Corp
Bought by
Gordon Jeffrey
Current Estimated Value
Home Financials for this Owner
Home Financials are based on the most recent Mortgage that was taken out on this home.
Original Mortgage
$47,621
Outstanding Balance
$31,470
Interest Rate
5%
Mortgage Type
FHA
Estimated Equity
$89,181
Purchase Details
Closed on
Jun 9, 2008
Sold by
Us Bank Na
Bought by
Style Development Corp
Home Financials for this Owner
Home Financials are based on the most recent Mortgage that was taken out on this home.
Original Mortgage
$15,000
Interest Rate
6.04%
Mortgage Type
Purchase Money Mortgage
Purchase Details
Closed on
Jul 25, 2007
Sold by
David Matthew and Keyes Melody
Bought by
Us Bank National Association
Purchase Details
Closed on
Apr 27, 2005
Sold by
Galway Properties Inc
Bought by
David Mattew and Keyes Melody
Home Financials for this Owner
Home Financials are based on the most recent Mortgage that was taken out on this home.
Original Mortgage
$66,600
Interest Rate
6.05%
Mortgage Type
New Conventional
Create a Home Valuation Report for This Property
The Home Valuation Report is an in-depth analysis detailing your home's value as well as a comparison with similar homes in the area
Home Values in the Area
Average Home Value in this Area
Purchase History
| Date | Buyer | Sale Price | Title Company |
|---|---|---|---|
| Gordon Jeffrey | $48,500 | None Available | |
| Style Development Corp | $10,000 | None Available | |
| Us Bank National Association | $45,869 | None Available | |
| David Mattew | $65,000 | None Available |
Source: Public Records
Mortgage History
| Date | Status | Borrower | Loan Amount |
|---|---|---|---|
| Open | Gordon Jeffrey | $47,621 | |
| Previous Owner | Style Development Corp | $15,000 | |
| Previous Owner | David Mattew | $66,600 |
Source: Public Records
Tax History Compared to Growth
Tax History
| Year | Tax Paid | Tax Assessment Tax Assessment Total Assessment is a certain percentage of the fair market value that is determined by local assessors to be the total taxable value of land and additions on the property. | Land | Improvement |
|---|---|---|---|---|
| 2025 | $1,378 | $87,380 | $15,760 | $71,620 |
| 2024 | $1,342 | $87,380 | $15,760 | $71,620 |
| 2023 | $1,290 | $87,380 | $15,760 | $71,620 |
| 2022 | $1,290 | $69,230 | $7,210 | $62,020 |
| 2021 | $1,638 | $85,250 | $7,210 | $78,040 |
| 2020 | $1,430 | $74,610 | $7,210 | $67,400 |
| 2019 | $1,609 | $74,610 | $7,210 | $67,400 |
| 2018 | $1,370 | $74,610 | $7,210 | $67,400 |
| 2017 | $1,422 | $71,060 | $7,210 | $63,850 |
| 2016 | $1,340 | $69,890 | $0 | $0 |
| 2015 | $1,340 | $65,440 | $0 | $0 |
| 2014 | $1,260 | $65,440 | $0 | $0 |
| 2013 | $1,234 | $0 | $0 | $0 |
| 2012 | -- | $58,720 | $6,790 | $51,930 |
Source: Public Records
Map
Nearby Homes
- 907 Pershing Ave
- 310 E 9th St
- 911 Pershing Ave
- 314 E 9th St
- 829 Pershing Ave
- 307 E 9th St
- 904 Pershing Ave
- 318 E 9th St
- 906 Pershing Ave
- 902 Pershing Ave
- 908 Pershing Ave
- 315 E 9th St
- 322 E 9th St
- 825 Pershing Ave
- 306 E 8 1/2 St
- 732 1/2 Pershing Ave
- 921 Pershing Ave
- 306 E 8 1 2 St
- 218 E 9th St
- 218 E 9th St Unit 217