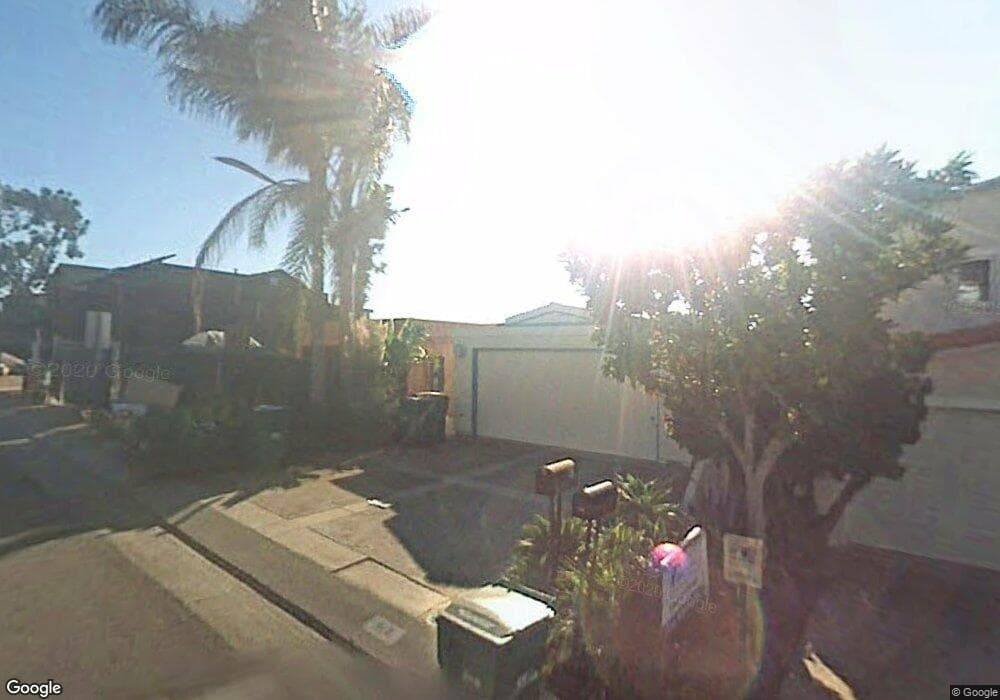
903 Quivera St Laguna Beach, CA 92651
Estimated Value: $2,094,893 - $2,464,000
3
Beds
3
Baths
1,779
Sq Ft
$1,282/Sq Ft
Est. Value
About This Home
This home is located at 903 Quivera St, Laguna Beach, CA 92651 and is currently estimated at $2,280,223, approximately $1,281 per square foot. 903 Quivera St is a home located in Orange County with nearby schools including Top Of The World Elementary School, Thurston Middle School, and Laguna Beach High School.
Ownership History
Date
Name
Owned For
Owner Type
Purchase Details
Closed on
Feb 28, 2020
Sold by
Yen Pei and Yen Monika
Bought by
Yen Pei Teh and Yen Monika
Current Estimated Value
Purchase Details
Closed on
Jun 1, 2009
Sold by
Yen Bing C and Yen Ann M
Bought by
Yen Pei and Yen Monika
Home Financials for this Owner
Home Financials are based on the most recent Mortgage that was taken out on this home.
Original Mortgage
$450,000
Outstanding Balance
$285,082
Interest Rate
4.82%
Mortgage Type
Seller Take Back
Estimated Equity
$1,995,141
Purchase Details
Closed on
Mar 16, 2005
Sold by
Yen Ann Margaret
Bought by
Yen Bing C
Purchase Details
Closed on
Mar 4, 2005
Sold by
Asset Investments Inc
Bought by
Yen Bing C and Yen Pei
Purchase Details
Closed on
Oct 23, 2003
Sold by
Sluk Steven and Sluk Sheila
Bought by
Asset Investments Inc
Home Financials for this Owner
Home Financials are based on the most recent Mortgage that was taken out on this home.
Original Mortgage
$445,000
Interest Rate
5.98%
Mortgage Type
Purchase Money Mortgage
Purchase Details
Closed on
Dec 11, 2002
Sold by
Witt Lillian
Bought by
Sluk Sheila
Purchase Details
Closed on
Jan 30, 1997
Sold by
Lillian Witt
Bought by
Witt Lillian and The Lillian Witt Living Trust
Create a Home Valuation Report for This Property
The Home Valuation Report is an in-depth analysis detailing your home's value as well as a comparison with similar homes in the area
Home Values in the Area
Average Home Value in this Area
Purchase History
| Date | Buyer | Sale Price | Title Company |
|---|---|---|---|
| Yen Pei Teh | -- | None Available | |
| Yen Pei | -- | None Available | |
| Yen Bing C | -- | Southland Title Corporation | |
| Yen Bing C | $447,000 | Southland Title Corporation | |
| Asset Investments Inc | $445,000 | Southland Title Company | |
| Sluk Sheila | -- | -- | |
| Witt Lillian | -- | -- |
Source: Public Records
Mortgage History
| Date | Status | Borrower | Loan Amount |
|---|---|---|---|
| Open | Yen Pei | $450,000 | |
| Previous Owner | Asset Investments Inc | $445,000 |
Source: Public Records
Tax History Compared to Growth
Tax History
| Year | Tax Paid | Tax Assessment Tax Assessment Total Assessment is a certain percentage of the fair market value that is determined by local assessors to be the total taxable value of land and additions on the property. | Land | Improvement |
|---|---|---|---|---|
| 2025 | $13,824 | $1,289,003 | $764,050 | $524,953 |
| 2024 | $13,824 | $1,263,729 | $749,069 | $514,660 |
| 2023 | $13,804 | $1,238,950 | $734,381 | $504,569 |
| 2022 | $13,485 | $1,214,657 | $719,981 | $494,676 |
| 2021 | $13,167 | $1,190,841 | $705,864 | $484,977 |
| 2020 | $12,966 | $1,178,631 | $698,626 | $480,005 |
| 2019 | $12,719 | $1,155,521 | $684,927 | $470,594 |
| 2018 | $12,457 | $1,132,864 | $671,497 | $461,367 |
| 2017 | $12,193 | $1,110,651 | $658,330 | $452,321 |
| 2016 | $11,946 | $1,088,874 | $645,422 | $443,452 |
| 2015 | $11,747 | $1,072,519 | $635,728 | $436,791 |
| 2014 | $11,512 | $1,051,510 | $623,275 | $428,235 |
Source: Public Records
Map
Nearby Homes
- 895 Quivera St
- 1071 Oro St
- 1596 Del Mar Ave
- 755 Pelican Dr
- 1285 Cortez
- 1077 Tia Juana St
- 1083 Tia Juana St
- 989 Miramar St
- 749 Marlin
- 739 Marlin
- 1165 Noria St
- 683 Alta Vista Way
- 480 Nyes Place
- 934 Bonnie Brae Ave
- 2480 Iris Way
- 1119 Katella St
- 629 Balboa Ave
- 426 Nyes Place
- 410 Nyes Place
- 1330 La Mirada St
- 913 Quivera St
- 917 Quivera St
- 1 Quivera St
- 0 Cortez Unit OC18173935
- 0 Cortez Unit P799365
- 0 Cortez Unit P820133
- 925 Quivera St
- 889 Quivera St
- 929 Quivera St
- 881 Quivera St
- 933 Quivera St
- 875 Quivera St
- 908 Quivera St
- 920 Quivera St
- 896 Quivera St
- 939 Quivera St
- 865 Quivera St
- 884 Quivera St
- 928 Quivera St
- 947 Quivera St