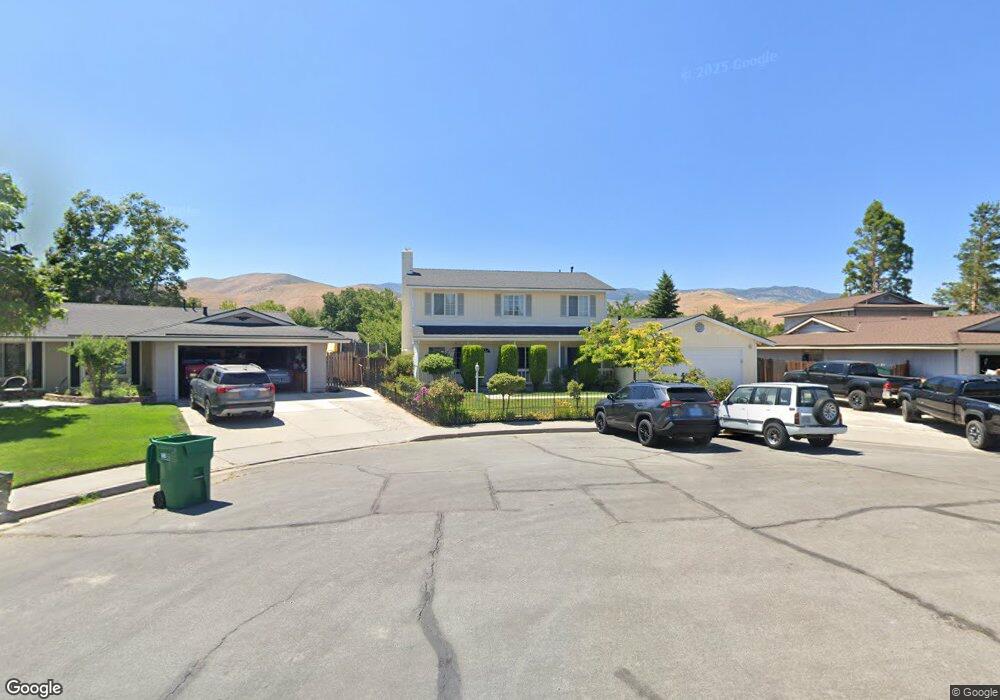
903 Rolando Way Unit 3C Carson City, NV 89701
Colorado Street NeighborhoodEstimated Value: $498,021 - $622,000
4
Beds
3
Baths
2,392
Sq Ft
$226/Sq Ft
Est. Value
About This Home
This home is located at 903 Rolando Way Unit 3C, Carson City, NV 89701 and is currently estimated at $541,755, approximately $226 per square foot. 903 Rolando Way Unit 3C is a home located in Carson City with nearby schools including Al Seeliger Elementary School, Eagle Valley Middle School, and Carson High School.
Ownership History
Date
Name
Owned For
Owner Type
Purchase Details
Closed on
Apr 9, 2019
Sold by
Avila Juan A
Bought by
Avila Juan A and Avila Narciso
Current Estimated Value
Purchase Details
Closed on
Aug 1, 2011
Sold by
Deavila Bertha Alicia Martinez
Bought by
Avila Juan A
Purchase Details
Closed on
Jul 29, 2011
Sold by
Rodriguez Maria
Bought by
Avila Jesus J
Purchase Details
Closed on
May 28, 2011
Sold by
The Bank Of New York Mellon
Bought by
Avila Juan A and Avilia Jesus J
Home Financials for this Owner
Home Financials are based on the most recent Mortgage that was taken out on this home.
Original Mortgage
$180,310
Interest Rate
4.62%
Mortgage Type
FHA
Purchase Details
Closed on
Sep 23, 2010
Sold by
Ravenelle William L and Ravenelle Sharon P
Bought by
The Bank Of New York Mellon and The Bank Of New York
Create a Home Valuation Report for This Property
The Home Valuation Report is an in-depth analysis detailing your home's value as well as a comparison with similar homes in the area
Home Values in the Area
Average Home Value in this Area
Purchase History
| Date | Buyer | Sale Price | Title Company |
|---|---|---|---|
| Avila Juan A | -- | None Listed On Document | |
| Avila Juan A | -- | Commerce Title Of America Ll | |
| Avila Jesus J | -- | Commerce Title Of America Ll | |
| Avila Juan A | $185,000 | Commerce Title & Closing Se | |
| The Bank Of New York Mellon | $166,500 | First American National D |
Source: Public Records
Mortgage History
| Date | Status | Borrower | Loan Amount |
|---|---|---|---|
| Previous Owner | Avila Juan A | $180,310 |
Source: Public Records
Tax History Compared to Growth
Tax History
| Year | Tax Paid | Tax Assessment Tax Assessment Total Assessment is a certain percentage of the fair market value that is determined by local assessors to be the total taxable value of land and additions on the property. | Land | Improvement |
|---|---|---|---|---|
| 2025 | $2,434 | $83,746 | $30,100 | $53,646 |
| 2024 | $2,364 | $85,321 | $30,100 | $55,221 |
| 2023 | $2,295 | $82,467 | $30,100 | $52,367 |
| 2022 | $2,125 | $74,114 | $26,250 | $47,864 |
| 2021 | $2,064 | $69,358 | $22,050 | $47,308 |
| 2020 | $2,064 | $66,230 | $19,075 | $47,155 |
| 2019 | $1,944 | $65,894 | $19,075 | $46,819 |
| 2018 | $1,846 | $61,390 | $18,200 | $43,190 |
| 2017 | $1,793 | $57,028 | $16,800 | $40,228 |
| 2016 | $1,748 | $54,930 | $13,440 | $41,490 |
| 2015 | $1,744 | $52,946 | $11,200 | $41,746 |
| 2014 | $1,693 | $47,811 | $8,750 | $39,061 |
Source: Public Records
Map
Nearby Homes
- 901 Rolando Way
- 612 Armory Ln
- 704 Sean Dr
- 2600 Silver Sage Dr
- 1001 Sonoma St
- 00 Sonoma St
- 3033 Doubletree Ln
- 410 Dublin St
- 3016 Hauser Ct
- 2454 Eastwood Dr
- 718 Travis Dr Unit D
- 634 Travis Dr
- 703 Travis Dr
- 507 Travis Dr
- 185 Windtree Cir
- 2391 Pinebrook Dr
- 3309 Hickory Dr
- 1717 Damon Rd
- 1673 Myles Way
- 2556 Blue Haven Ln