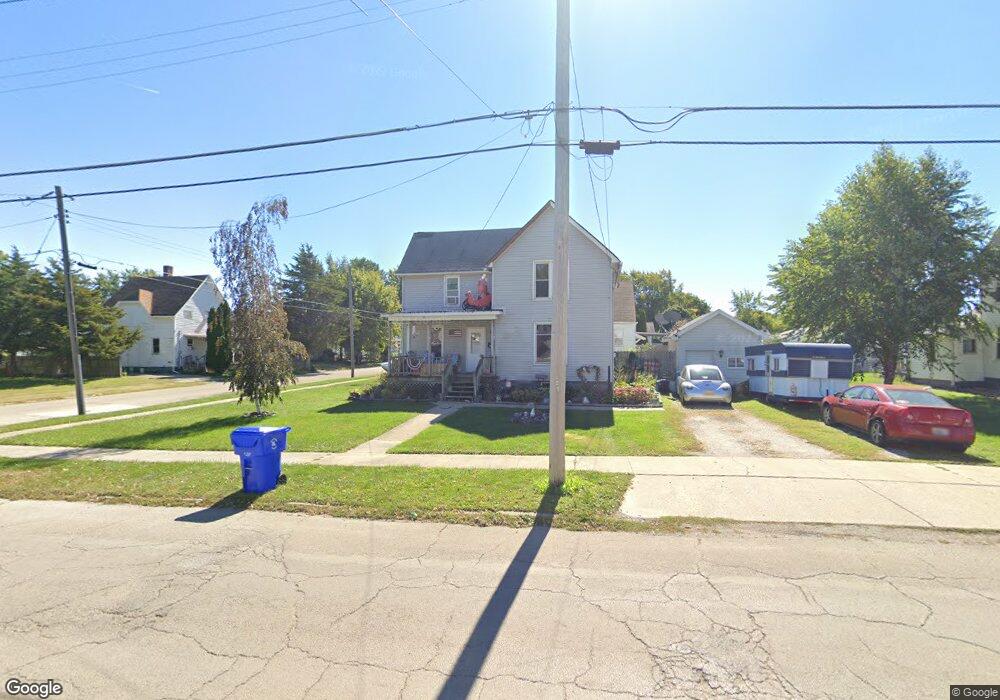
903 Rose St Kewanee, IL 61443
Estimated Value: $59,000 - $75,000
3
Beds
1
Bath
900
Sq Ft
$76/Sq Ft
Est. Value
About This Home
This home is located at 903 Rose St, Kewanee, IL 61443 and is currently estimated at $68,016, approximately $75 per square foot. 903 Rose St is a home located in Henry County with nearby schools including Kewanee High School and Visitation Catholic School.
Ownership History
Date
Name
Owned For
Owner Type
Purchase Details
Closed on
Sep 3, 2020
Sold by
Americole Inc
Bought by
Resource Center Llc and Falcon Ventures Inc
Current Estimated Value
Purchase Details
Closed on
Aug 21, 2020
Sold by
Orange Capital Funding Llc
Bought by
Americole Inc
Purchase Details
Closed on
Oct 15, 2015
Sold by
Harbour Portfolio Vi Lp
Bought by
Orange Capital Llc
Purchase Details
Closed on
Jan 27, 2011
Sold by
Fannie Mae
Bought by
Harbour Portfolio Vi Lp
Purchase Details
Closed on
Jun 15, 2010
Sold by
Marsh Joey L and Marsh Joan M
Bought by
Federal National Mortgage Association
Create a Home Valuation Report for This Property
The Home Valuation Report is an in-depth analysis detailing your home's value as well as a comparison with similar homes in the area
Home Values in the Area
Average Home Value in this Area
Purchase History
| Date | Buyer | Sale Price | Title Company |
|---|---|---|---|
| Resource Center Llc | -- | None Available | |
| Americole Inc | -- | Attorney | |
| Orange Capital Llc | -- | Attorney | |
| Harbour Portfolio Vi Lp | $5,331 | None Available | |
| Federal National Mortgage Association | -- | None Available |
Source: Public Records
Tax History
| Year | Tax Paid | Tax Assessment Tax Assessment Total Assessment is a certain percentage of the fair market value that is determined by local assessors to be the total taxable value of land and additions on the property. | Land | Improvement |
|---|---|---|---|---|
| 2024 | $1,605 | $20,872 | $1,368 | $19,504 |
| 2023 | $1,383 | $18,471 | $1,211 | $17,260 |
| 2022 | $1,217 | $16,807 | $1,102 | $15,705 |
| 2021 | $1,112 | $15,562 | $1,020 | $14,542 |
| 2020 | $1,077 | $15,220 | $998 | $14,222 |
| 2019 | $1,126 | $15,880 | $1,041 | $14,839 |
| 2018 | $1,180 | $16,271 | $1,067 | $15,204 |
| 2017 | $1,152 | $16,062 | $1,053 | $15,009 |
| 2016 | $1,170 | $16,225 | $1,064 | $15,161 |
| 2015 | $865 | $15,954 | $1,046 | $14,908 |
| 2013 | $865 | $16,269 | $1,073 | $15,196 |
Source: Public Records
Map
Nearby Homes
- 512 Commercial St
- 716 W 3rd St
- 422 Ross St
- 702 Elliott St Unit 1
- 215 W Prospect St
- 136 W Mill St
- 732 S Main St
- 0 N Main St Unit E 2nd
- 328 E Prospect St
- 436 Hollis St
- 522 E 5th St
- 116 W Garfield St
- 712 Roosevelt Ave
- 701 E 9th St
- 202 Regina Ct
- 1221 June St
- 24508 County Highway 28
- 2283 E 2750th St
- 806 NE 3rd St
- 2769 Olof Krans Ave
Your Personal Tour Guide
Ask me questions while you tour the home.