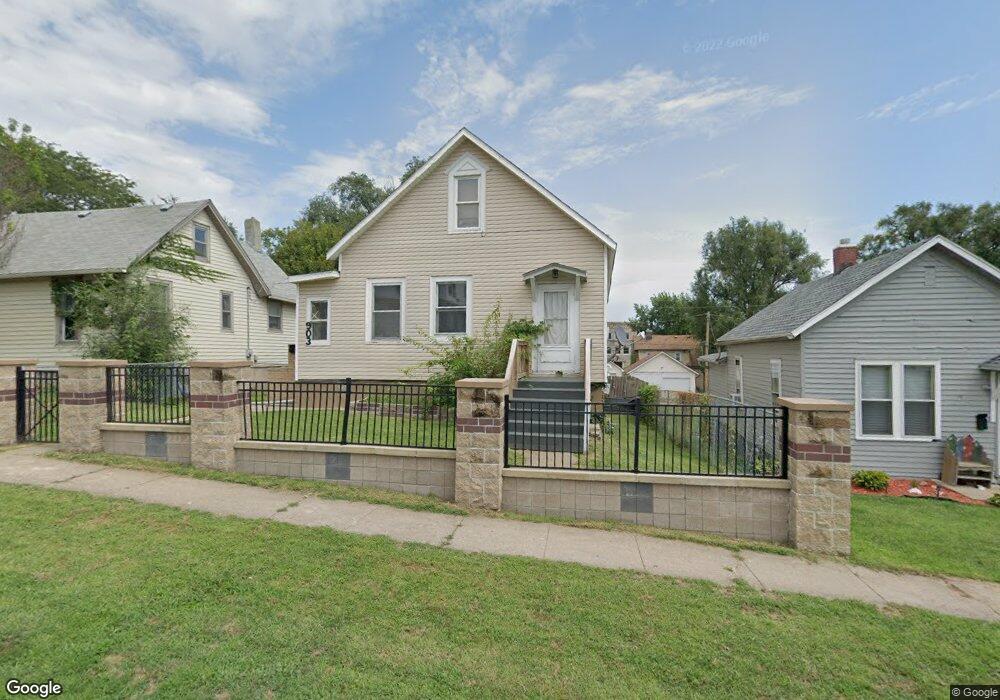
903 S 25th Ave Omaha, NE 68105
Columbus Park NeighborhoodEstimated Value: $198,000 - $244,000
4
Beds
1
Bath
1,520
Sq Ft
$146/Sq Ft
Est. Value
About This Home
This home is located at 903 S 25th Ave, Omaha, NE 68105 and is currently estimated at $222,348, approximately $146 per square foot. 903 S 25th Ave is a home located in Douglas County with nearby schools including Liberty Elementary School, Norris Middle School, and Central High School.
Ownership History
Date
Name
Owned For
Owner Type
Purchase Details
Closed on
Mar 23, 2005
Sold by
Montelongo Pedro A
Bought by
Montelongo Pedro A
Current Estimated Value
Purchase Details
Closed on
Sep 16, 2003
Sold by
Beltran Jose
Bought by
Montelongo Pedro Antonio
Home Financials for this Owner
Home Financials are based on the most recent Mortgage that was taken out on this home.
Original Mortgage
$88,511
Interest Rate
6.22%
Mortgage Type
FHA
Create a Home Valuation Report for This Property
The Home Valuation Report is an in-depth analysis detailing your home's value as well as a comparison with similar homes in the area
Home Values in the Area
Average Home Value in this Area
Purchase History
| Date | Buyer | Sale Price | Title Company |
|---|---|---|---|
| Montelongo Pedro A | $18,000 | -- | |
| Montelongo Pedro Antonio | $90,000 | -- |
Source: Public Records
Mortgage History
| Date | Status | Borrower | Loan Amount |
|---|---|---|---|
| Previous Owner | Montelongo Pedro Antonio | $88,511 |
Source: Public Records
Tax History Compared to Growth
Tax History
| Year | Tax Paid | Tax Assessment Tax Assessment Total Assessment is a certain percentage of the fair market value that is determined by local assessors to be the total taxable value of land and additions on the property. | Land | Improvement |
|---|---|---|---|---|
| 2025 | $3,410 | $196,600 | $16,800 | $179,800 |
| 2024 | $2,504 | $196,600 | $16,800 | $179,800 |
| 2023 | $2,504 | $118,700 | $16,800 | $101,900 |
| 2022 | $2,491 | $116,700 | $14,800 | $101,900 |
| 2021 | $1,987 | $93,900 | $14,800 | $79,100 |
| 2020 | $2,010 | $93,900 | $14,800 | $79,100 |
| 2019 | $1,623 | $75,600 | $3,200 | $72,400 |
| 2018 | $1,170 | $54,400 | $3,200 | $51,200 |
| 2017 | $1,175 | $54,400 | $3,200 | $51,200 |
| 2016 | $1,167 | $54,400 | $3,200 | $51,200 |
| 2015 | $1,152 | $54,400 | $3,200 | $51,200 |
| 2014 | $1,152 | $54,400 | $3,200 | $51,200 |
Source: Public Records
Map
Nearby Homes
- 2565 Mason St
- 2567 Marcy St
- 2609 Marcy St
- 818 S 26th St
- 2619 Rees St
- 2575 Pierce St
- 2715 Pacific St
- 1214 S 25th Ave
- 2408 Poppleton Ave
- 1204 S 27th St
- 1050 S 29th St
- 2111 Pierce St
- 1322 S 24th St
- 1039 Park Ave
- 2710 Howard St
- 1501 S 25th Ave
- 2313 Harney St Unit 2001
- 2315 Harney St Unit 204
- 1120 Park Ave
- 649 S 19th Ave