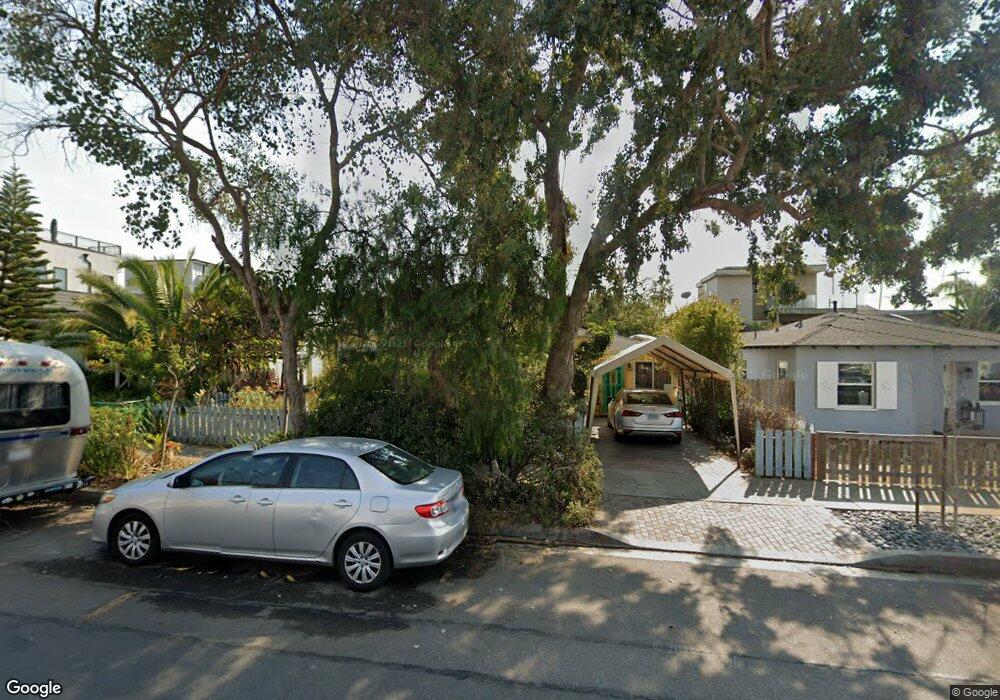
903 Tourmaline St San Diego, CA 92109
Pacific Beach NeighborhoodEstimated Value: $2,063,871 - $2,579,000
3
Beds
2
Baths
1,978
Sq Ft
$1,202/Sq Ft
Est. Value
About This Home
This home is located at 903 Tourmaline St, San Diego, CA 92109 and is currently estimated at $2,376,968, approximately $1,201 per square foot. 903 Tourmaline St is a home located in San Diego County with nearby schools including Pacific Beach Elementary School, Pacific Beach Middle, and Mission Bay High School.
Ownership History
Date
Name
Owned For
Owner Type
Purchase Details
Closed on
Sep 11, 2002
Sold by
Zabka Alisa E and Zabka George G
Bought by
Zabka Pedersen Alisa and Zabka George G
Current Estimated Value
Home Financials for this Owner
Home Financials are based on the most recent Mortgage that was taken out on this home.
Original Mortgage
$100,000
Outstanding Balance
$42,170
Interest Rate
6.37%
Mortgage Type
Credit Line Revolving
Estimated Equity
$2,334,798
Purchase Details
Closed on
Aug 15, 2002
Sold by
Zabka Alisa E and Zabka George G
Bought by
Pedersen Alisa Z and Zabka George G
Home Financials for this Owner
Home Financials are based on the most recent Mortgage that was taken out on this home.
Original Mortgage
$100,000
Outstanding Balance
$42,170
Interest Rate
6.37%
Mortgage Type
Credit Line Revolving
Estimated Equity
$2,334,798
Purchase Details
Closed on
Mar 18, 1995
Sold by
Zabka Alisa E
Bought by
Zabka Alisa E and Zabka George G
Purchase Details
Closed on
Feb 10, 1995
Sold by
Zabka Lynne G
Bought by
Zabka George G
Purchase Details
Closed on
Nov 19, 1993
Sold by
Conolly Robert C and Conolly Ann D
Bought by
Zabka Alisa E
Create a Home Valuation Report for This Property
The Home Valuation Report is an in-depth analysis detailing your home's value as well as a comparison with similar homes in the area
Home Values in the Area
Average Home Value in this Area
Purchase History
| Date | Buyer | Sale Price | Title Company |
|---|---|---|---|
| Zabka Pedersen Alisa | -- | New Century Title Company | |
| Pedersen Alisa Z | -- | -- | |
| Zabka Alisa E | -- | -- | |
| Zabka George G | -- | -- | |
| Zabka Alisa E | $245,000 | First American Title Co |
Source: Public Records
Mortgage History
| Date | Status | Borrower | Loan Amount |
|---|---|---|---|
| Open | Zabka Pedersen Alisa | $100,000 |
Source: Public Records
Tax History Compared to Growth
Tax History
| Year | Tax Paid | Tax Assessment Tax Assessment Total Assessment is a certain percentage of the fair market value that is determined by local assessors to be the total taxable value of land and additions on the property. | Land | Improvement |
|---|---|---|---|---|
| 2025 | $6,136 | $513,837 | $348,423 | $165,414 |
| 2024 | $6,136 | $503,763 | $341,592 | $162,171 |
| 2023 | $5,998 | $493,887 | $334,895 | $158,992 |
| 2022 | $5,837 | $484,204 | $328,329 | $155,875 |
| 2021 | $5,796 | $474,711 | $321,892 | $152,819 |
| 2020 | $5,725 | $469,845 | $318,592 | $151,253 |
| 2019 | $5,622 | $460,634 | $312,346 | $148,288 |
| 2018 | $5,255 | $451,603 | $306,222 | $145,381 |
| 2017 | $5,128 | $442,749 | $300,218 | $142,531 |
| 2016 | $5,045 | $434,069 | $294,332 | $139,737 |
| 2015 | $4,969 | $427,550 | $289,911 | $137,639 |
| 2014 | $4,890 | $419,176 | $284,233 | $134,943 |
Source: Public Records
Map
Nearby Homes
- 938 Opal St
- 972 Sapphire St Unit LA1
- 974 Sapphire St Unit LA2
- 976 Sapphire St Unit LA3
- 4944 Cass St Unit 604
- 4944 Cass St Unit 407
- 751-63 Turquoise St Unit 27-30
- 1025 Wilbur Ave
- 1059 Agate St Unit A
- 1154 Sapphire St
- 1148 Turquoise St
- 819 Van Nuys St
- 1045 Van Nuys St
- 4767 Ocean Blvd
- 4767 Ocean Blvd Unit 411
- 5416 Candlelight Dr
- 5209 Foothill Blvd
- 5452 Moonlight Ln
- 623 Colima St
- 4667 Ocean Blvd Unit 106
- 875 Tourmaline St
- 911 Tourmaline St Unit 13
- 919 Tourmaline St
- 5076 Bayard St
- 867 Tourmaline St
- 859 Tourmaline St
- 876 Tourmaline St
- 902 Opal St
- 876 Opal St Unit 78
- 924 Opal St
- 904 Opal St
- 904 Tourmaline St
- 912 Opal St Unit 14
- 5075 Bayard St Unit 81
- 920 Tourmaline St
- 868 Opal St
- 849 Tourmaline St
- 860 Opal St
- 868 Tourmaline St Unit 70
- 928 Opal St