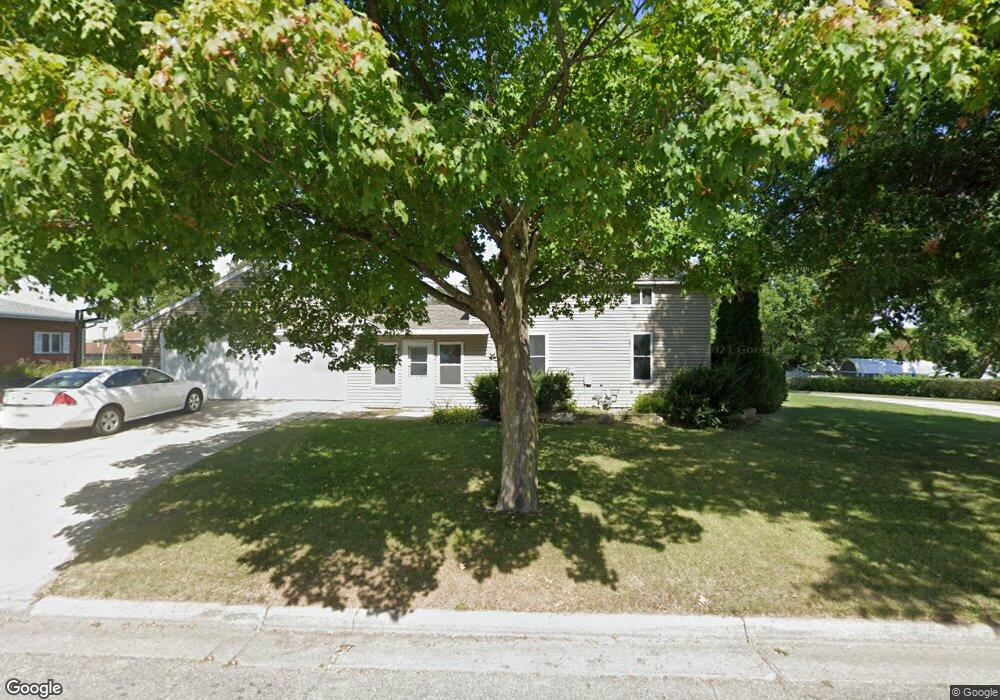
903 W 16th St Vinton, IA 52349
Estimated Value: $165,698 - $219,000
3
Beds
1
Bath
1,244
Sq Ft
$155/Sq Ft
Est. Value
About This Home
This home is located at 903 W 16th St, Vinton, IA 52349 and is currently estimated at $193,425, approximately $155 per square foot. 903 W 16th St is a home located in Benton County with nearby schools including Tilford Elementary School, Shellsburg Elementary School, and Vinton-Shellsburg Middle School.
Ownership History
Date
Name
Owned For
Owner Type
Purchase Details
Closed on
Apr 27, 2021
Sold by
Rundlett Robert Frank
Bought by
Shaw Bradey W
Current Estimated Value
Home Financials for this Owner
Home Financials are based on the most recent Mortgage that was taken out on this home.
Original Mortgage
$121,500
Outstanding Balance
$109,875
Interest Rate
3.1%
Mortgage Type
New Conventional
Estimated Equity
$83,550
Purchase Details
Closed on
Mar 20, 2013
Sold by
Us Bank Na
Bought by
Secretary Of Hud
Purchase Details
Closed on
May 13, 2010
Sold by
Neuzil Jeremy J and Neuzil Allison
Bought by
Northrup Benjamin D
Home Financials for this Owner
Home Financials are based on the most recent Mortgage that was taken out on this home.
Original Mortgage
$85,424
Interest Rate
5.16%
Mortgage Type
FHA
Create a Home Valuation Report for This Property
The Home Valuation Report is an in-depth analysis detailing your home's value as well as a comparison with similar homes in the area
Home Values in the Area
Average Home Value in this Area
Purchase History
| Date | Buyer | Sale Price | Title Company |
|---|---|---|---|
| Shaw Bradey W | $135,000 | None Available | |
| Secretary Of Hud | -- | None Available | |
| Northrup Benjamin D | -- | None Available |
Source: Public Records
Mortgage History
| Date | Status | Borrower | Loan Amount |
|---|---|---|---|
| Open | Shaw Bradey W | $121,500 | |
| Previous Owner | Northrup Benjamin D | $85,424 |
Source: Public Records
Tax History Compared to Growth
Tax History
| Year | Tax Paid | Tax Assessment Tax Assessment Total Assessment is a certain percentage of the fair market value that is determined by local assessors to be the total taxable value of land and additions on the property. | Land | Improvement |
|---|---|---|---|---|
| 2025 | $2,454 | $144,700 | $17,400 | $127,300 |
| 2024 | $2,454 | $131,000 | $17,100 | $113,900 |
| 2023 | $2,290 | $131,000 | $17,100 | $113,900 |
| 2022 | $2,350 | $106,400 | $13,600 | $92,800 |
| 2021 | $2,350 | $106,400 | $13,600 | $92,800 |
| 2020 | $2,570 | $118,800 | $11,200 | $107,600 |
| 2019 | $2,474 | $118,800 | $11,200 | $107,600 |
| 2018 | $1,378 | $112,900 | $10,600 | $102,300 |
| 2017 | $1,834 | $64,700 | $10,600 | $54,100 |
| 2016 | $1,804 | $83,600 | $9,900 | $73,700 |
| 2015 | $1,804 | $83,600 | $9,900 | $73,700 |
| 2014 | $1,658 | $76,700 | $0 | $0 |
Source: Public Records
Map
Nearby Homes