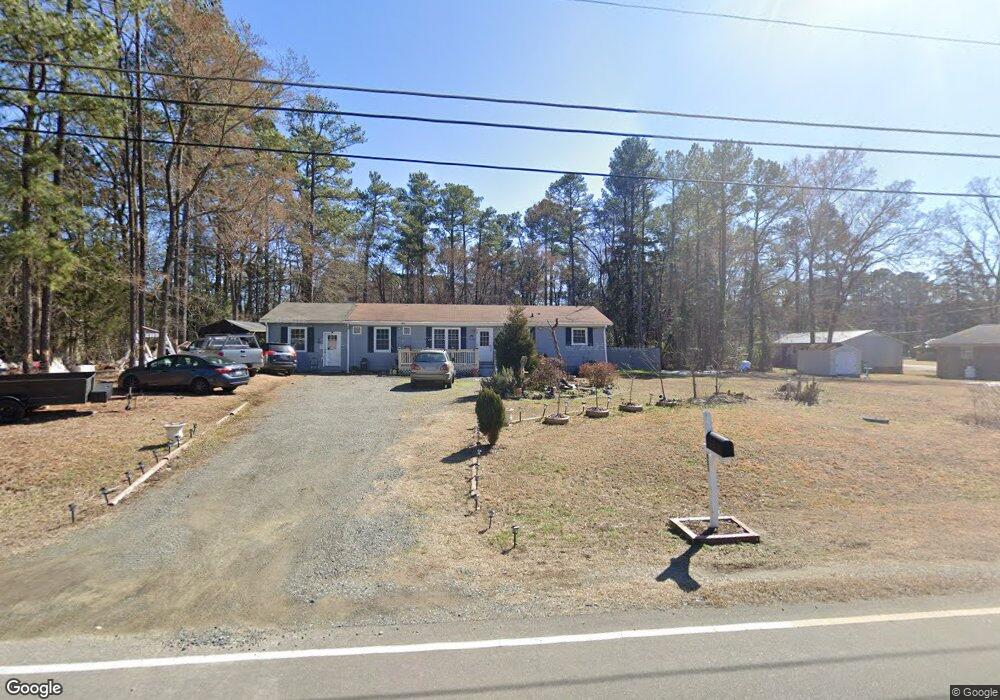
903 W D St Butner, NC 27509
Estimated Value: $212,531 - $238,000
Studio
1
Bath
1,312
Sq Ft
$174/Sq Ft
Est. Value
About This Home
This home is located at 903 W D St, Butner, NC 27509 and is currently estimated at $227,883, approximately $173 per square foot. 903 W D St is a home located in Granville County with nearby schools including Butner-Stem Elementary School, Butner-Stem Middle School, and Granville Central High School.
Ownership History
Date
Name
Owned For
Owner Type
Purchase Details
Closed on
Mar 7, 2018
Sold by
Heyme Steve
Bought by
Yuquilima Maria Concepclon Alvarado
Current Estimated Value
Home Financials for this Owner
Home Financials are based on the most recent Mortgage that was taken out on this home.
Original Mortgage
$99,000
Outstanding Balance
$87,403
Interest Rate
5.75%
Mortgage Type
Adjustable Rate Mortgage/ARM
Estimated Equity
$140,480
Purchase Details
Closed on
Feb 19, 2010
Sold by
Hoyme Nancy
Bought by
Hoyme Steve
Purchase Details
Closed on
Mar 24, 2006
Sold by
Kesseliman Scott and Kesseliman Teresa B
Bought by
Hoyme Steve and Hoyme Nancy
Purchase Details
Closed on
Sep 7, 2005
Sold by
Williams James A
Bought by
Bierman John Michael and Bierman Mary Ann
Home Financials for this Owner
Home Financials are based on the most recent Mortgage that was taken out on this home.
Original Mortgage
$26,500
Interest Rate
5.86%
Mortgage Type
Purchase Money Mortgage
Create a Home Valuation Report for This Property
The Home Valuation Report is an in-depth analysis detailing your home's value as well as a comparison with similar homes in the area
Purchase History
| Date | Buyer | Sale Price | Title Company |
|---|---|---|---|
| Yuquilima Maria Concepclon Alvarado | $110,000 | None Available | |
| Hoyme Steve | -- | -- | |
| Hoyme Steve | $25,500 | -- | |
| Bierman John Michael | $46,000 | -- |
Source: Public Records
Mortgage History
| Date | Status | Borrower | Loan Amount |
|---|---|---|---|
| Open | Yuquilima Maria Concepclon Alvarado | $99,000 | |
| Previous Owner | Bierman John Michael | $26,500 |
Source: Public Records
Tax History
| Year | Tax Paid | Tax Assessment Tax Assessment Total Assessment is a certain percentage of the fair market value that is determined by local assessors to be the total taxable value of land and additions on the property. | Land | Improvement |
|---|---|---|---|---|
| 2025 | $1,978 | $180,228 | $16,500 | $163,728 |
| 2024 | $1,978 | $180,228 | $16,500 | $163,728 |
| 2023 | $1,310 | $95,398 | $13,200 | $82,198 |
| 2022 | $1,299 | $95,398 | $13,200 | $82,198 |
| 2021 | $1,237 | $95,398 | $13,200 | $82,198 |
| 2020 | $1,237 | $95,398 | $13,200 | $82,198 |
| 2019 | $1,237 | $95,398 | $13,200 | $82,198 |
| 2018 | $1,237 | $95,398 | $13,200 | $82,198 |
| 2016 | $1,289 | $91,219 | $13,200 | $78,019 |
| 2015 | $1,224 | $91,219 | $13,200 | $78,019 |
| 2014 | $1,224 | $91,219 | $13,200 | $78,019 |
| 2013 | -- | $91,219 | $13,200 | $78,019 |
Source: Public Records
Map
Nearby Homes
- 1205 W C St
- 503 Central Ave
- 600 18th St
- 1725 Cobblestone Dr
- 1739 Cobblestone Dr
- 1098 Blackstone Dr
- Lot 4 Will Suitt Rd
- 1693 Will Suitt Rd
- 1149 Shasta Ct
- 1180 Andrews Ct
- 1171 Jackson Ct
- 1198 E Middleton Dr
- 1214 Hunter Ct
- 1495 Concord Church Rd
- 1613 Hunters Trail
- 2040 Applewood Dr
- 1576 Munns Rd
- 1580 Rogers Pointe Ln
- 1589 Rogers Pointe Ln
- 104 Margaret Dr
Your Personal Tour Guide
Ask me questions while you tour the home.