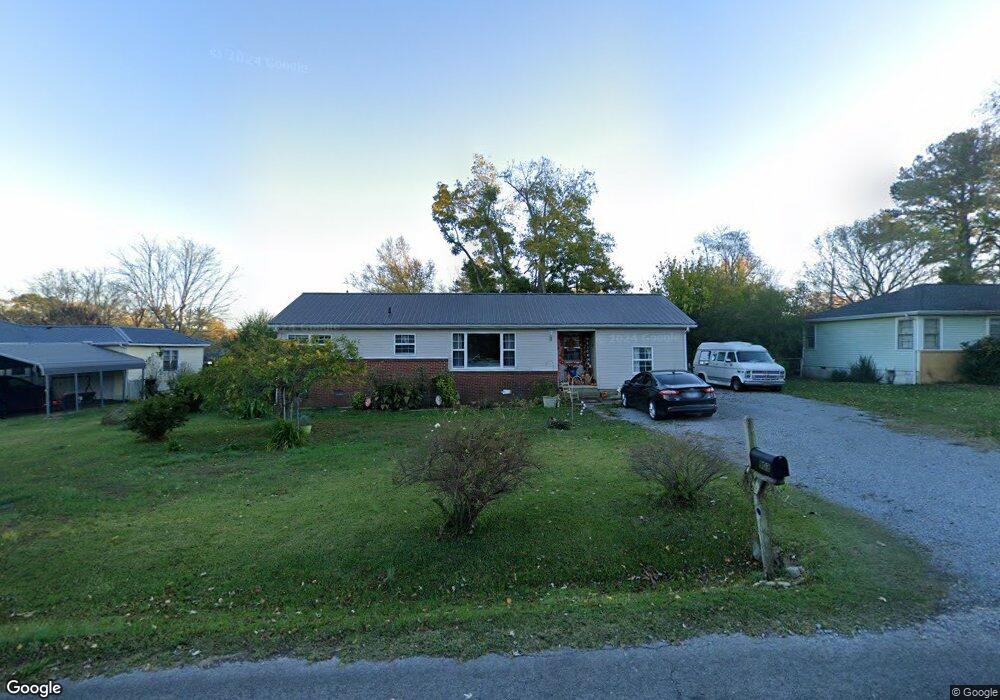
903 W Hickory St Tullahoma, TN 37388
Estimated Value: $155,625 - $227,000
--
Bed
1
Bath
1,296
Sq Ft
$150/Sq Ft
Est. Value
About This Home
This home is located at 903 W Hickory St, Tullahoma, TN 37388 and is currently estimated at $193,906, approximately $149 per square foot. 903 W Hickory St is a home located in Coffee County with nearby schools including Tullahoma High School, Tullahoma Christian Academy, and Highland Rim Christian Academy.
Ownership History
Date
Name
Owned For
Owner Type
Purchase Details
Closed on
Jun 9, 2008
Sold by
Hopkins Daphne
Bought by
Maples Angela M
Current Estimated Value
Purchase Details
Closed on
Sep 13, 2005
Sold by
Greene Barbara
Bought by
Mitchell Daphne
Home Financials for this Owner
Home Financials are based on the most recent Mortgage that was taken out on this home.
Original Mortgage
$58,500
Interest Rate
8.75%
Purchase Details
Closed on
Nov 3, 2003
Sold by
Clark Bussell
Bought by
Bussell Barbara
Purchase Details
Closed on
Sep 2, 1997
Purchase Details
Closed on
Aug 8, 1997
Sold by
Mangino Charles S
Bought by
Mangino Charles
Purchase Details
Closed on
Jan 1, 1985
Bought by
Mangino Charles S and Mangino Melissa
Create a Home Valuation Report for This Property
The Home Valuation Report is an in-depth analysis detailing your home's value as well as a comparison with similar homes in the area
Home Values in the Area
Average Home Value in this Area
Purchase History
| Date | Buyer | Sale Price | Title Company |
|---|---|---|---|
| Maples Angela M | $91,950 | -- | |
| Mitchell Daphne | $65,000 | -- | |
| Bussell Barbara | -- | -- | |
| -- | $38,000 | -- | |
| Mangino Charles | -- | -- | |
| Mangino Charles S | $34,000 | -- |
Source: Public Records
Mortgage History
| Date | Status | Borrower | Loan Amount |
|---|---|---|---|
| Previous Owner | Mangino Charles S | $58,500 |
Source: Public Records
Tax History Compared to Growth
Tax History
| Year | Tax Paid | Tax Assessment Tax Assessment Total Assessment is a certain percentage of the fair market value that is determined by local assessors to be the total taxable value of land and additions on the property. | Land | Improvement |
|---|---|---|---|---|
| 2024 | $1,126 | $27,400 | $2,500 | $24,900 |
| 2023 | $1,070 | $27,400 | $0 | $0 |
| 2022 | $1,098 | $27,400 | $2,500 | $24,900 |
| 2021 | $1,058 | $21,125 | $2,500 | $18,625 |
| 2020 | $1,058 | $21,125 | $2,500 | $18,625 |
| 2019 | $1,058 | $21,125 | $2,500 | $18,625 |
| 2018 | $1,058 | $21,125 | $2,500 | $18,625 |
| 2017 | $1,078 | $19,725 | $2,500 | $17,225 |
| 2016 | $1,079 | $19,725 | $2,500 | $17,225 |
| 2015 | $1,079 | $19,725 | $2,500 | $17,225 |
| 2014 | $1,079 | $19,729 | $0 | $0 |
Source: Public Records
Map
Nearby Homes
- 812 Bel Aire Dr
- 408 Peachtree St
- 201 Peachtree St
- 701 Cedar Ln
- 810 W Lincoln St
- 108 Fleming St
- 808 Maplehill Dr
- 1311 Bel Aire Dr
- 202 S Collins St
- 103 Noblitt Ct
- 412 Campbell Ave
- 208 Bragg Cir
- 206 Bragg Cir
- 103 Deery Ln
- 303 Old Fort St
- 24 Cedar Ln
- 22 Cedar Ln
- 25 Cedar Ln
- 700 Bragg Cir
- 400 Edgewood Dr