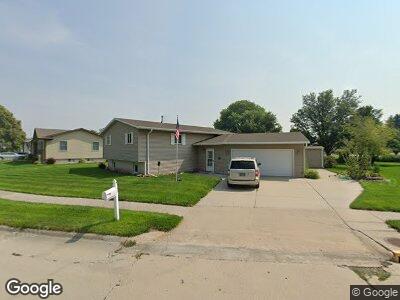
903 West Ave Gibbon, NE 68840
Estimated Value: $233,000 - $263,000
4
Beds
2
Baths
1,140
Sq Ft
$216/Sq Ft
Est. Value
About This Home
This home is located at 903 West Ave, Gibbon, NE 68840 and is currently estimated at $246,337, approximately $216 per square foot. 903 West Ave is a home with nearby schools including Gibbon Elementary School and Gibbon High School.
Ownership History
Date
Name
Owned For
Owner Type
Purchase Details
Closed on
Nov 24, 2021
Sold by
Shafer Richard L and Shafer Karla K
Bought by
Avila Alejandro Gomez and Gomez Taylor Marie
Current Estimated Value
Home Financials for this Owner
Home Financials are based on the most recent Mortgage that was taken out on this home.
Original Mortgage
$222,789
Outstanding Balance
$207,366
Interest Rate
3.09%
Mortgage Type
FHA
Estimated Equity
$20,916
Create a Home Valuation Report for This Property
The Home Valuation Report is an in-depth analysis detailing your home's value as well as a comparison with similar homes in the area
Home Values in the Area
Average Home Value in this Area
Purchase History
| Date | Buyer | Sale Price | Title Company |
|---|---|---|---|
| Avila Alejandro Gomez | $227,000 | Central Nebraska Title |
Source: Public Records
Mortgage History
| Date | Status | Borrower | Loan Amount |
|---|---|---|---|
| Open | Avila Alejandro Gomez | $222,789 | |
| Previous Owner | Shafer Richard L | $48,279 | |
| Previous Owner | Shafer Richard L | $10,000 |
Source: Public Records
Tax History Compared to Growth
Tax History
| Year | Tax Paid | Tax Assessment Tax Assessment Total Assessment is a certain percentage of the fair market value that is determined by local assessors to be the total taxable value of land and additions on the property. | Land | Improvement |
|---|---|---|---|---|
| 2024 | $2,810 | $164,850 | $17,285 | $147,565 |
| 2023 | $3,237 | $163,110 | $17,285 | $145,825 |
| 2022 | $3,022 | $150,810 | $17,285 | $133,525 |
| 2021 | $2,239 | $138,690 | $17,285 | $121,405 |
| 2020 | $2,479 | $136,895 | $17,285 | $119,610 |
| 2019 | $2,737 | $133,300 | $17,285 | $116,015 |
| 2018 | $2,804 | $136,895 | $17,285 | $119,610 |
| 2017 | $2,723 | $136,735 | $17,285 | $119,450 |
| 2016 | $2,574 | $135,000 | $17,285 | $117,715 |
| 2015 | $2,092 | $107,850 | $0 | $0 |
| 2014 | $2,322 | $109,085 | $0 | $0 |
Source: Public Records
Map
Nearby Homes