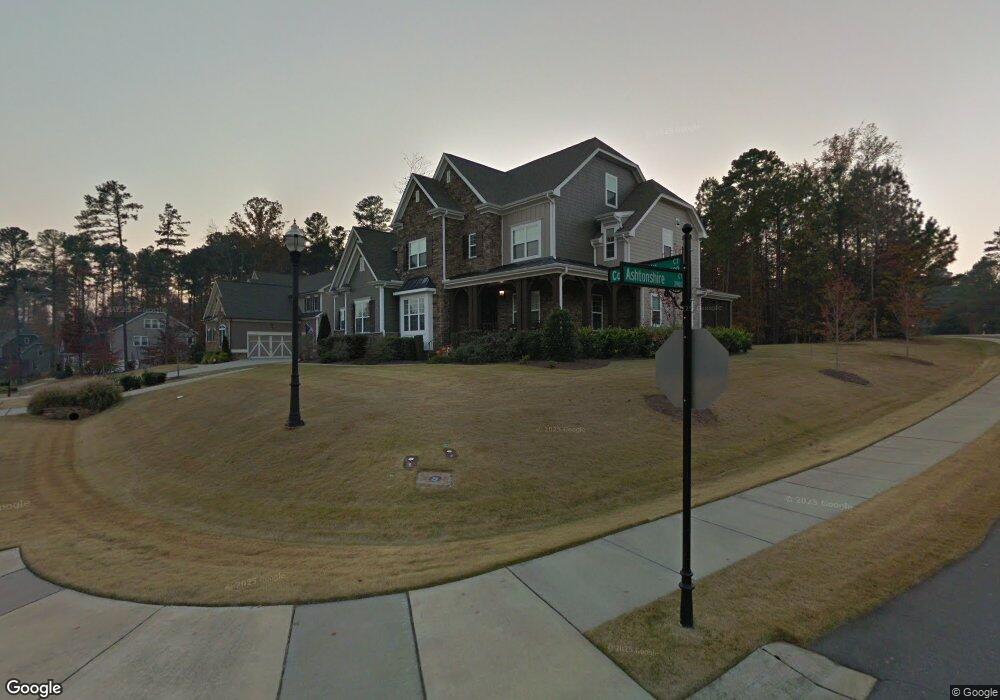
9031 Concord Hill Ct Raleigh, NC 27613
Northwest Raleigh NeighborhoodEstimated Value: $1,173,271 - $1,324,000
5
Beds
5
Baths
4,240
Sq Ft
$300/Sq Ft
Est. Value
About This Home
This home is located at 9031 Concord Hill Ct, Raleigh, NC 27613 and is currently estimated at $1,270,818, approximately $299 per square foot. 9031 Concord Hill Ct is a home located in Wake County with nearby schools including Leesville Road Middle School, Leesville Road High School, and Quest Academy.
Ownership History
Date
Name
Owned For
Owner Type
Purchase Details
Closed on
Jun 21, 2019
Sold by
Wilson Christopher N and Wilson Heather R
Bought by
Macdonald Jeffrey C and Macdonald Kellie P
Current Estimated Value
Home Financials for this Owner
Home Financials are based on the most recent Mortgage that was taken out on this home.
Original Mortgage
$484,350
Outstanding Balance
$424,999
Interest Rate
4%
Mortgage Type
New Conventional
Estimated Equity
$845,819
Purchase Details
Closed on
Nov 29, 2012
Sold by
Weekley Homes Llc
Bought by
Wilson Christopher N and Wilson Heather R
Home Financials for this Owner
Home Financials are based on the most recent Mortgage that was taken out on this home.
Original Mortgage
$114,000
Interest Rate
3.4%
Mortgage Type
Credit Line Revolving
Purchase Details
Closed on
Apr 18, 2012
Sold by
Jbgl Inwood Llc
Bought by
Weekley Homes Llc and Weekley Homes Lp
Purchase Details
Closed on
Sep 30, 2011
Sold by
Jerry Wagoner Construction Inc
Bought by
Jbgl Inwood Llc
Create a Home Valuation Report for This Property
The Home Valuation Report is an in-depth analysis detailing your home's value as well as a comparison with similar homes in the area
Home Values in the Area
Average Home Value in this Area
Purchase History
| Date | Buyer | Sale Price | Title Company |
|---|---|---|---|
| Macdonald Jeffrey C | $788,000 | None Available | |
| Wilson Christopher N | $664,500 | None Available | |
| Weekley Homes Llc | $404,000 | None Available | |
| Jbgl Inwood Llc | $622,500 | None Available |
Source: Public Records
Mortgage History
| Date | Status | Borrower | Loan Amount |
|---|---|---|---|
| Open | Macdonald Jeffrey C | $484,350 | |
| Previous Owner | Wilson Christopher N | $114,000 | |
| Previous Owner | Wilson Christopher N | $417,000 |
Source: Public Records
Tax History Compared to Growth
Tax History
| Year | Tax Paid | Tax Assessment Tax Assessment Total Assessment is a certain percentage of the fair market value that is determined by local assessors to be the total taxable value of land and additions on the property. | Land | Improvement |
|---|---|---|---|---|
| 2025 | $8,699 | $995,140 | $225,000 | $770,140 |
| 2024 | $8,663 | $995,140 | $225,000 | $770,140 |
| 2023 | $8,694 | $795,777 | $180,000 | $615,777 |
| 2022 | $8,077 | $795,777 | $180,000 | $615,777 |
| 2021 | $7,763 | $795,777 | $180,000 | $615,777 |
| 2020 | $7,621 | $795,777 | $180,000 | $615,777 |
| 2019 | $7,568 | $651,278 | $140,000 | $511,278 |
| 2018 | $7,136 | $651,278 | $140,000 | $511,278 |
| 2017 | $6,795 | $651,278 | $140,000 | $511,278 |
| 2016 | $6,655 | $651,278 | $140,000 | $511,278 |
| 2015 | $7,484 | $720,808 | $152,000 | $568,808 |
| 2014 | -- | $720,808 | $152,000 | $568,808 |
Source: Public Records
Map
Nearby Homes
- 5020 Celbridge Place
- 10109 Goodview Ct
- 8802 Fidelis Ln
- 8801 Wildwood Links
- 3812 Covina Dr
- 12909 Baybriar Dr
- 8326 Ray Rd
- 8701 Oneal Rd
- 9305 Field Maple Ct
- 9309 Field Maple Ct
- 8604 Wellsley Way
- 8701 Gleneagles Dr
- 8605 Brookdale Dr
- 5009 Wood Valley Dr
- 2704 Smokey Ridge Rd
- 8404 Sleepy Creek Dr
- 13217 Ashford Park Dr
- 13204 Ashford Park Dr
- 3008 Eden Harbor Ct
- 10729 Winding Wood Trail
- 9027 Concord Hill Ct
- 9101 Concord Hill Ct
- 3911 Ashtonshire Ct
- 3910 Ashtonshire Ct
- 3910 Ashtonshire Ct Unit 38
- 9032 Concord Hill Ct
- 9102 Concord Hill Ct
- 9104 Ray Rd
- 9028 Concord Hill Ct
- 9023 Concord Hill Ct
- 3912 Ashtonshire Ct
- 9024 Concord Hill Ct
- 9111 Concord Hill Ct
- 9111 Concord Hill Ct Unit Lt 40
- 9106 Concord Hill Ct
- 9104 Aspenshire Ct
- 9100 Ray Rd
- 9105 Aspenshire Ct
- 9105 Aspenshire Ct Unit Lt 46
- 9110 Concord Hill Ct