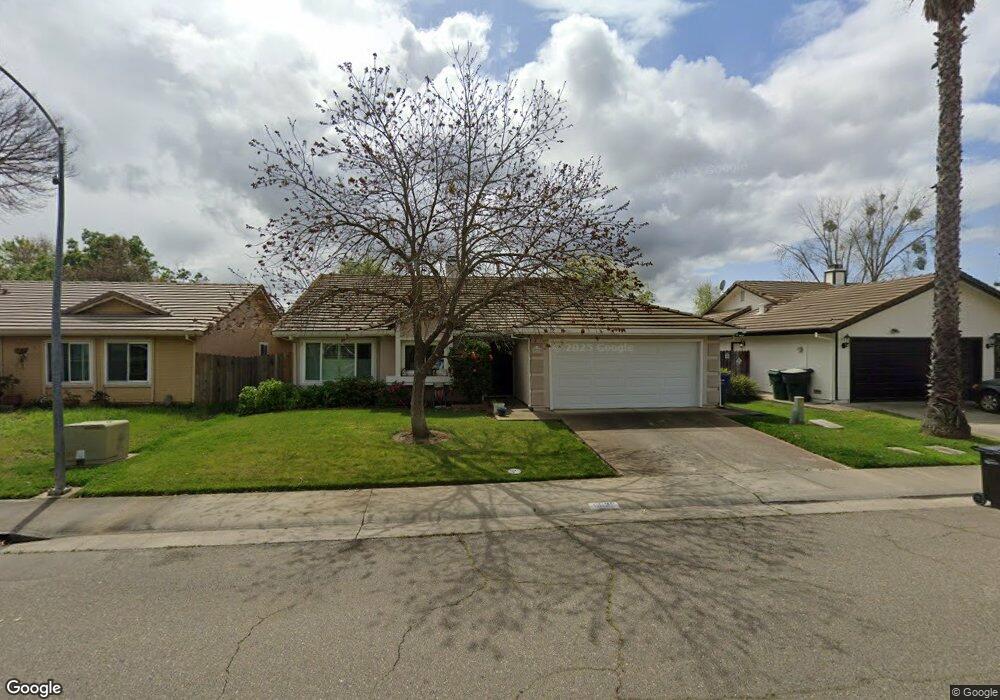
9032 Carlisle Ave Sacramento, CA 95829
Estimated Value: $422,000 - $530,000
3
Beds
2
Baths
1,565
Sq Ft
$315/Sq Ft
Est. Value
About This Home
This home is located at 9032 Carlisle Ave, Sacramento, CA 95829 and is currently estimated at $492,985, approximately $315 per square foot. 9032 Carlisle Ave is a home located in Sacramento County with nearby schools including Maeola E. Beitzel Elementary School, T. R. Smedberg Middle School, and Sheldon High School.
Ownership History
Date
Name
Owned For
Owner Type
Purchase Details
Closed on
Oct 21, 2004
Sold by
Filippi Lawrence J
Bought by
Filippi Lawrence J and The Lawrence J Filippi Living
Current Estimated Value
Purchase Details
Closed on
Jun 30, 2000
Sold by
Ngo Nguyen Doanh D and Ngo Huong L
Bought by
Filippi Lawrence J
Home Financials for this Owner
Home Financials are based on the most recent Mortgage that was taken out on this home.
Original Mortgage
$146,778
Interest Rate
8.67%
Mortgage Type
VA
Purchase Details
Closed on
Dec 30, 1997
Sold by
Nguyen Duat D and Nguyen Huong
Bought by
Nguyen Doanh D and Ngo Huong L
Home Financials for this Owner
Home Financials are based on the most recent Mortgage that was taken out on this home.
Original Mortgage
$105,500
Interest Rate
7.16%
Create a Home Valuation Report for This Property
The Home Valuation Report is an in-depth analysis detailing your home's value as well as a comparison with similar homes in the area
Home Values in the Area
Average Home Value in this Area
Purchase History
| Date | Buyer | Sale Price | Title Company |
|---|---|---|---|
| Filippi Lawrence J | -- | -- | |
| Filippi Lawrence J | $147,000 | Alliance Title Company | |
| Nguyen Doanh D | -- | Fidelity National Title Co |
Source: Public Records
Mortgage History
| Date | Status | Borrower | Loan Amount |
|---|---|---|---|
| Previous Owner | Filippi Lawrence J | $146,778 | |
| Previous Owner | Nguyen Doanh D | $105,500 |
Source: Public Records
Tax History Compared to Growth
Tax History
| Year | Tax Paid | Tax Assessment Tax Assessment Total Assessment is a certain percentage of the fair market value that is determined by local assessors to be the total taxable value of land and additions on the property. | Land | Improvement |
|---|---|---|---|---|
| 2025 | $2,482 | $221,145 | $42,178 | $178,967 |
| 2024 | $2,482 | $216,809 | $41,351 | $175,458 |
| 2023 | $2,496 | $212,559 | $40,541 | $172,018 |
| 2022 | $2,456 | $208,393 | $39,747 | $168,646 |
| 2021 | $2,431 | $204,308 | $38,968 | $165,340 |
| 2020 | $2,400 | $202,214 | $38,569 | $163,645 |
| 2019 | $2,359 | $198,250 | $37,813 | $160,437 |
| 2018 | $2,300 | $194,364 | $37,072 | $157,292 |
| 2017 | $2,263 | $190,554 | $36,346 | $154,208 |
| 2016 | $2,156 | $186,819 | $35,634 | $151,185 |
| 2015 | $2,119 | $184,014 | $35,099 | $148,915 |
| 2014 | $2,086 | $180,410 | $34,412 | $145,998 |
Source: Public Records
Map
Nearby Homes
- 8977 Carlisle Ave
- 9042 Epernay Ct
- 8880 Sonoma Valley Way
- 8048 Caymus Dr
- 7904 Symington Way
- 7929 Symington Way
- 8054 Boeger Ct
- 7984 Munhall Ct
- 8901 Leland Ave
- 8005 Delage Way
- 8837 Navarrin Way
- 8916 Hollowstone Way
- 9040 Durness Way
- 8841 Billfish Way
- 9172 Durness Way
- 7790 Finnhorse Way
- 8762 Lemas Rd
- 8990 Chantal Way
- 8034 Kelty Ct
- 8798 Caselman Rd
- 9036 Carlisle Ave
- 9028 Carlisle Ave
- 9049 Napa Valley Way
- 9024 Carlisle Ave
- 9045 Napa Valley Way
- 9053 Napa Valley Way
- 9041 Napa Valley Way
- 9033 Carlisle Ave
- 9020 Carlisle Ave
- 9029 Carlisle Ave
- 9057 Napa Valley Way
- 7950 Caymus Dr
- 9037 Napa Valley Way
- 7954 Caymus Dr
- 9025 Carlisle Ave
- 7958 Caymus Dr
- 9016 Carlisle Ave
- 9021 Carlisle Ave
- 9033 Napa Valley Way
- 9061 Napa Valley Way