O
Seller's Agent in 2019
OUTSIDE AGENT
OTHER
71 in this area
5,688 Total Sales
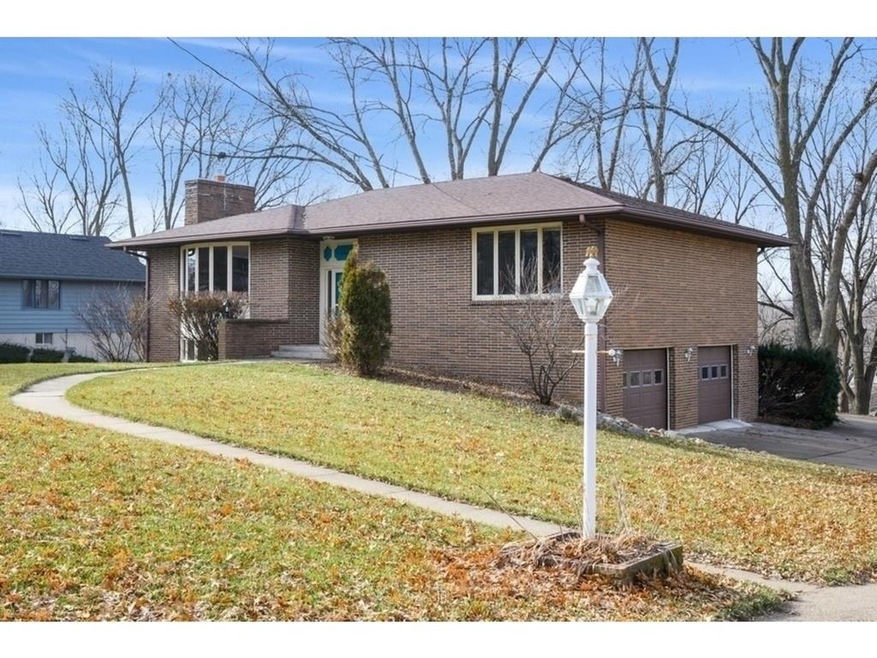
Estimated Value: $221,000 - $252,000
FSBO
We collect this data history from publicly available records. To have your information removed, we recommend requesting removal directly through your county’s website.
We collect this data history from publicly available records. To have your information removed, we recommend requesting removal directly through your county’s website.
| Date | Buyer | Sale Price | Title Company |
|---|---|---|---|
| -- | None Listed On Document | ||
| -- | None Listed On Document | ||
| -- | None Listed On Document | ||
| $147,000 | None Listed On Document | ||
| -- | None Listed On Document | ||
| $160,000 | None Available | ||
| -- | None Available | ||
| $146,531 | None Available |
We collect this data history from publicly available records. To have your information removed, we recommend requesting removal directly through your county’s website.
| Date | Status | Borrower | Loan Amount |
|---|---|---|---|
| Previous Owner | $110,250 | ||
| Previous Owner | $157,102 | ||
| Previous Owner | $144,015 |
We collect this data history from publicly available records. To have your information removed, we recommend requesting removal directly through your county’s website.
| Date | Event | Price | List to Sale | Price per Sq Ft |
|---|---|---|---|---|
| 07/12/2019 07/12/19 | Sold | $160,000 | -8.6% | $148 / Sq Ft |
| 06/12/2019 06/12/19 | Pending | -- | -- | -- |
| 05/19/2019 05/19/19 | For Sale | $175,000 | -- | $162 / Sq Ft |
We collect this data history from publicly available records. To have your information removed, we recommend requesting removal directly through your county’s website.
| Year | Tax Paid | Tax Assessment Tax Assessment Total Assessment is a certain percentage of the fair market value that is determined by local assessors to be the total taxable value of land and additions on the property. | Land | Improvement |
|---|---|---|---|---|
| 2025 | $3,888 | $210,300 | $50,300 | $160,000 |
| 2024 | $3,876 | $191,800 | $33,500 | $158,300 |
| 2023 | $3,970 | $191,800 | $33,500 | $158,300 |
| 2022 | $3,956 | $165,400 | $33,500 | $131,900 |
| 2021 | $3,962 | $165,400 | $33,500 | $131,900 |
| 2020 | $3,962 | $156,300 | $33,500 | $122,800 |
| 2019 | $3,138 | $156,300 | $33,500 | $122,800 |
| 2018 | $3,038 | $133,300 | $0 | $0 |
| 2017 | $3,022 | $133,300 | $0 | $0 |
| 2016 | $2,988 | $128,300 | $0 | $0 |
| 2015 | $2,988 | $128,300 | $0 | $0 |
| 2014 | $2,900 | $124,600 | $0 | $0 |
O
Seller's Agent in 2019
OUTSIDE AGENT
OTHER
71 in this area
5,688 Total Sales

Buyer's Agent in 2019
Michael Volquardsen
Local Realty Company
(515) 494-5733
78 Total Sales
Source: Des Moines Area Association of REALTORS®
MLS Number: 586812
APN: 63149000110
Disclaimer: Certain information contained herein is derived from information provided by parties other than Homes.com. All information provided is deemed reliable, but is not guaranteed to be accurate and should be independently verified.
![]() IDX information is provided exclusively for personal, non-commercial use, and may not be used for any purpose other than to identify prospective properties consumers may be interested in purchasing. Information is deemed reliable but not guaranteed.
IDX information is provided exclusively for personal, non-commercial use, and may not be used for any purpose other than to identify prospective properties consumers may be interested in purchasing. Information is deemed reliable but not guaranteed.
Ask me questions while you tour the home.