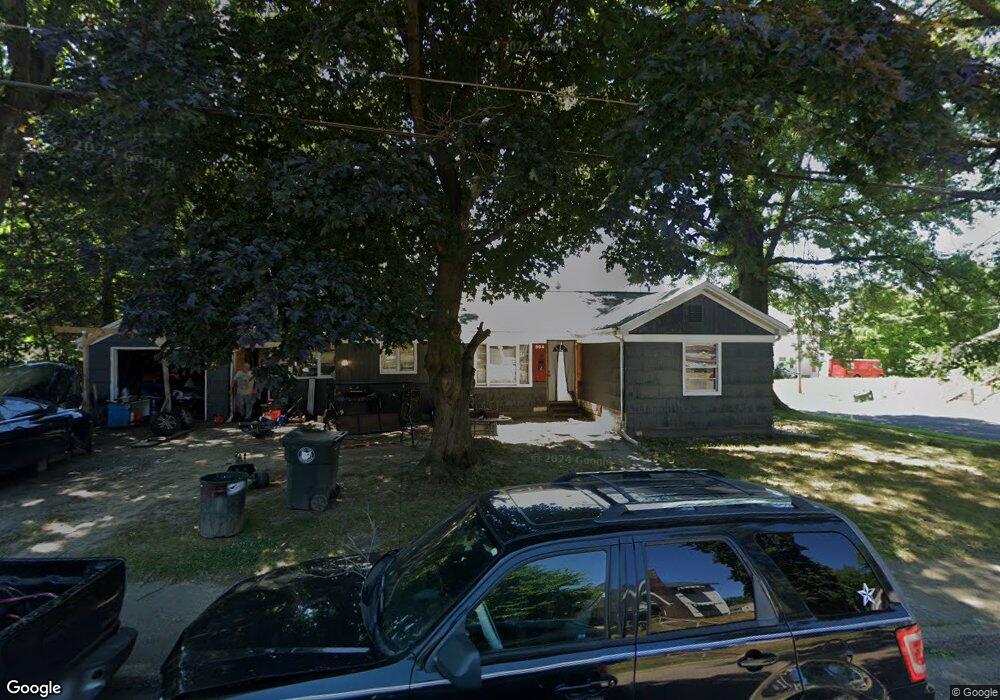
904 14th St NE Canton, OH 44714
Gibbs Area NeighborhoodEstimated Value: $73,000 - $115,000
3
Beds
2
Baths
1,240
Sq Ft
$71/Sq Ft
Est. Value
About This Home
This home is located at 904 14th St NE, Canton, OH 44714 and is currently estimated at $87,748, approximately $70 per square foot. 904 14th St NE is a home located in Stark County with nearby schools including Early Learning Center @ Schreiber, Gibbs Elementary School, and Youtz Intermediate School.
Ownership History
Date
Name
Owned For
Owner Type
Purchase Details
Closed on
Jan 6, 2021
Sold by
Demarco John S and Demarco John
Bought by
Suede Rentals Ltd
Current Estimated Value
Purchase Details
Closed on
Feb 26, 2009
Sold by
John Galt Enterprises Llc
Bought by
Demarco John S
Purchase Details
Closed on
Jan 14, 2009
Sold by
National City Bank
Bought by
John Galt Enterprises Llc
Purchase Details
Closed on
Jul 2, 2008
Sold by
Boswell Bonnie
Bought by
National City Bank
Purchase Details
Closed on
Oct 28, 2002
Sold by
Sbaraglia Mary Christine
Bought by
Boswell Bonnie
Home Financials for this Owner
Home Financials are based on the most recent Mortgage that was taken out on this home.
Original Mortgage
$42,000
Interest Rate
6%
Mortgage Type
Purchase Money Mortgage
Purchase Details
Closed on
Nov 1, 1999
Sold by
Myers Mary C
Bought by
Myers Mary Charlotte and Mary Charlotte Myers Revocable Trust
Create a Home Valuation Report for This Property
The Home Valuation Report is an in-depth analysis detailing your home's value as well as a comparison with similar homes in the area
Home Values in the Area
Average Home Value in this Area
Purchase History
| Date | Buyer | Sale Price | Title Company |
|---|---|---|---|
| Suede Rentals Ltd | -- | None Available | |
| Demarco John S | $7,200 | Real Estate Title | |
| John Galt Enterprises Llc | $1,000 | Stewart Re Title | |
| National City Bank | $40,000 | None Available | |
| Boswell Bonnie | $52,500 | -- | |
| Myers Mary Charlotte | -- | -- |
Source: Public Records
Mortgage History
| Date | Status | Borrower | Loan Amount |
|---|---|---|---|
| Previous Owner | Boswell Bonnie | $42,000 | |
| Closed | Boswell Bonnie | $10,500 |
Source: Public Records
Tax History Compared to Growth
Tax History
| Year | Tax Paid | Tax Assessment Tax Assessment Total Assessment is a certain percentage of the fair market value that is determined by local assessors to be the total taxable value of land and additions on the property. | Land | Improvement |
|---|---|---|---|---|
| 2025 | -- | $9,950 | $3,960 | $5,990 |
| 2024 | -- | $9,950 | $3,960 | $5,990 |
| 2023 | $531 | $8,680 | $2,870 | $5,810 |
| 2022 | $309 | $8,680 | $2,870 | $5,810 |
| 2021 | $312 | $8,680 | $2,870 | $5,810 |
| 2020 | $151 | $7,500 | $2,490 | $5,010 |
| 2019 | $12 | $7,500 | $2,490 | $5,010 |
| 2018 | $686 | $11,560 | $2,490 | $9,070 |
| 2017 | $445 | $6,800 | $3,540 | $3,260 |
| 2016 | $447 | $6,800 | $3,540 | $3,260 |
| 2015 | $73 | $6,800 | $3,540 | $3,260 |
| 2014 | $492 | $7,000 | $3,640 | $3,360 |
| 2013 | $102 | $12,390 | $3,640 | $8,750 |
Source: Public Records
Map
Nearby Homes
- 1412 Miami Ct NE
- 1422 Plain Ave NE
- 1332 Spring Ave NE
- 1322 Struble Ave NE
- 1454 Spring Ave NE
- 1376 Cherry Ave NE
- 1447 Shriver Ave NE
- 1540 Miami Ct NE
- 1325 Maddrell Ct NE
- 0 Young Ave NE Unit 5145944
- 1611 Rowland Ave NE
- 211 15th St NE
- 1515 Parkhill Place NE
- 1525 14th St NE
- 1631 Shriver Ave NE
- 1210 17th St NE
- 1421 Market Ave N
- 1219 17th St NE
- 1605 12th St NE
- 1517 16th St NE
- 1336 Plain Ave NE
- 912 14th St NE
- 1328 Plain Ave NE
- 907 14th St NE
- 901 14th St NE
- 911 14th St NE
- 1343 Plain Ave NE
- 1335 Plain Ave NE
- 1339 Plain Ave NE
- 1324 Plain Ave NE
- 915 14th St NE
- 1403 Plain Ave NE
- 1331 Plain Ave NE
- 1410 Plain Ave NE
- 1005 Sherlock Place NE
- 921 14th St NE
- 924 14th St NE
- 811 14th St NE
- 1007 Sherlock Place NE
- 1325 Plain Ave NE