Estimated Value: $501,000 - $582,000
3
Beds
2
Baths
1,802
Sq Ft
$309/Sq Ft
Est. Value
About This Home
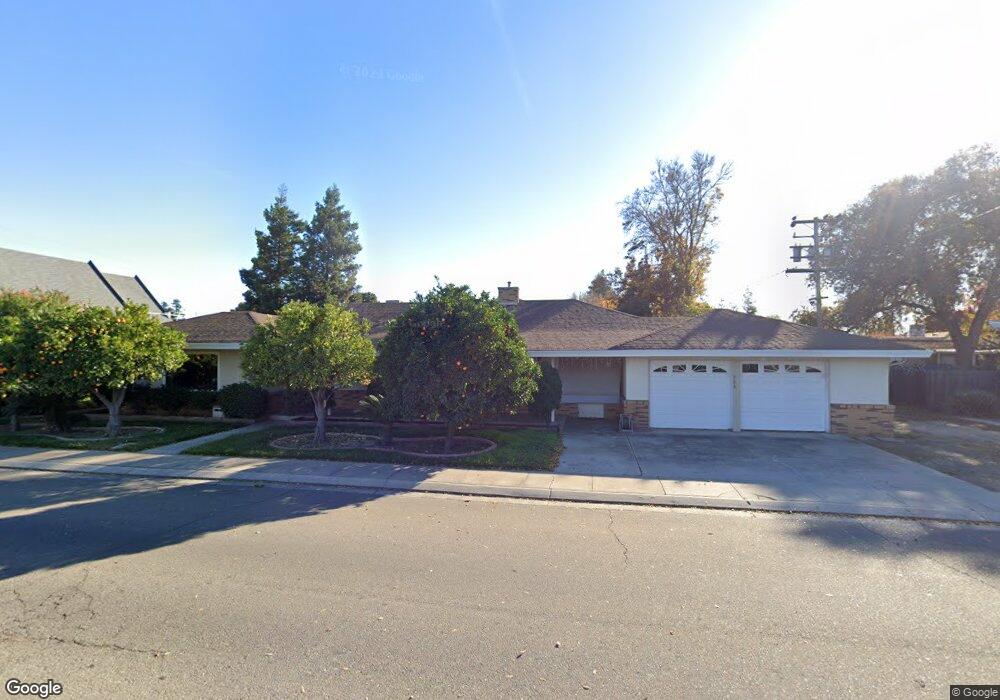
This home is located at 904 2nd St, Ripon, CA 95366 and is currently estimated at $556,270, approximately $308 per square foot. 904 2nd St is a home located in San Joaquin County with nearby schools including Ripon Elementary School, Weston Elementary School, and Park View Elementary School.
Ownership History
Date
Name
Owned For
Owner Type
Purchase Details
Closed on
Mar 29, 2023
Sold by
Sanchez Alice Ann
Bought by
Antonio Sanchez Benitez And Alice Ann Sanchez
Current Estimated Value
Purchase Details
Closed on
Dec 1, 2022
Sold by
Georgia E Rosendale Residual Trust
Bought by
Sanchez Alice Ann
Purchase Details
Closed on
Apr 19, 2006
Sold by
Rosendale David and Rosendale David
Bought by
Rosendale David and Rosendale Residual T Georgia E
Purchase Details
Closed on
Dec 30, 1997
Sold by
Antonio Sanchez
Bought by
Rosendale David and Rosendale Georgia
Purchase Details
Closed on
May 18, 1995
Sold by
E & J Bogarin Development Corp
Bought by
Sanchez Antonio and Sanchez Alice A
Create a Home Valuation Report for This Property
The Home Valuation Report is an in-depth analysis detailing your home's value as well as a comparison with similar homes in the area
Home Values in the Area
Average Home Value in this Area
Purchase History
| Date | Buyer | Sale Price | Title Company |
|---|---|---|---|
| Antonio Sanchez Benitez And Alice Ann Sanchez | -- | None Listed On Document | |
| Sanchez Alice Ann | -- | -- | |
| Rosendale David | -- | None Available | |
| Rosendale David | $150,000 | -- | |
| Sanchez Antonio | $48,000 | Chicago Title Company |
Source: Public Records
Tax History
| Year | Tax Paid | Tax Assessment Tax Assessment Total Assessment is a certain percentage of the fair market value that is determined by local assessors to be the total taxable value of land and additions on the property. | Land | Improvement |
|---|---|---|---|---|
| 2025 | $1,906 | $165,896 | $50,765 | $115,131 |
| 2024 | $1,876 | $162,644 | $49,770 | $112,874 |
| 2023 | $1,840 | $159,456 | $48,795 | $110,661 |
| 2022 | $1,812 | $156,331 | $47,839 | $108,492 |
| 2021 | $1,785 | $153,266 | $46,901 | $106,365 |
| 2020 | $1,770 | $151,696 | $46,421 | $105,275 |
| 2019 | $1,741 | $148,722 | $45,511 | $103,211 |
| 2018 | $1,716 | $145,807 | $44,619 | $101,188 |
| 2017 | $1,684 | $142,949 | $43,745 | $99,204 |
| 2016 | $1,658 | $140,146 | $42,887 | $97,259 |
| 2015 | $1,639 | $138,042 | $42,243 | $95,799 |
| 2014 | $1,599 | $135,338 | $41,416 | $93,922 |
Source: Public Records
Map
Nearby Homes
- 136 N Acacia Ave
- 150 N Acacia Ave
- 138 Roxie Ct
- 205 3rd St
- 410 Pine St
- 947 Doak Blvd
- 23811 S Jack Tone Rd
- 1621 Davis St
- 1671 Davis St
- 1080 Zumstein Dr
- 336 Kristen Way
- 818 Travaille Way
- 1434 Augusta Pointe Dr
- 1672 Bailey Dr
- 663 Clay Way
- 622 N Stockton Ave
- 244 California St
- 960 Goodwin Dr
- 255 Osbourne Ct
- 565 Bodeson Ct
Your Personal Tour Guide
Ask me questions while you tour the home.