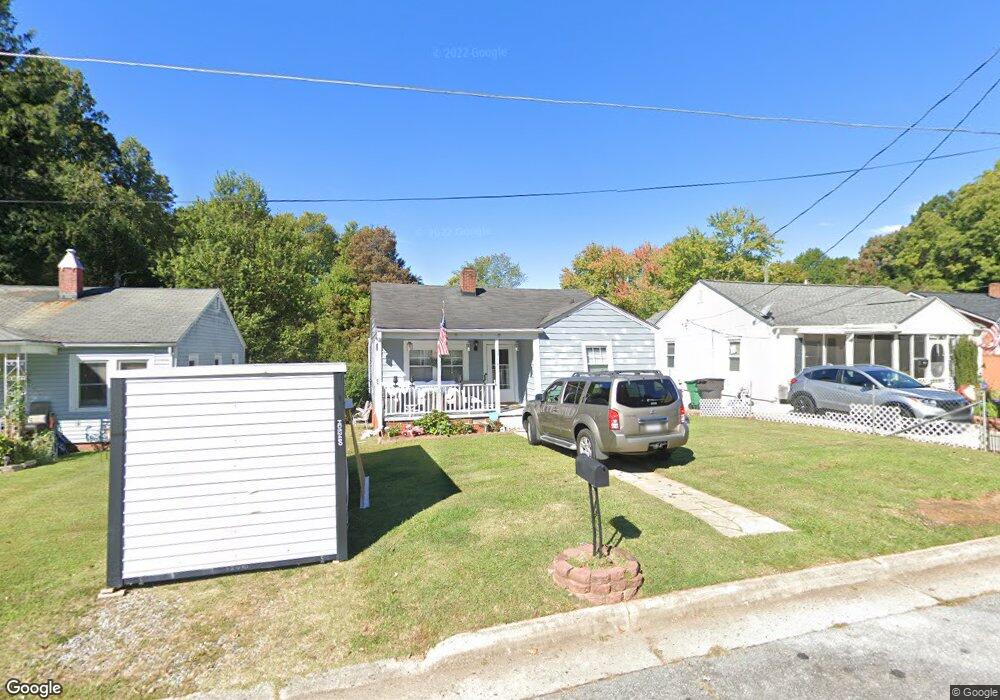
904 Arch St High Point, NC 27260
Greater High Point NeighborhoodEstimated Value: $117,000 - $145,000
2
Beds
1
Bath
888
Sq Ft
$142/Sq Ft
Est. Value
About This Home
This home is located at 904 Arch St, High Point, NC 27260 and is currently estimated at $126,353, approximately $142 per square foot. 904 Arch St is a home located in Guilford County with nearby schools including Fairview Elementary School, Ferndale Middle School, and High Point Central High School.
Ownership History
Date
Name
Owned For
Owner Type
Purchase Details
Closed on
Oct 30, 2017
Sold by
Phillips April L and Strickland April Leanne
Bought by
Phillips William Lee and Phillips Carolyn Carpenter
Current Estimated Value
Purchase Details
Closed on
Feb 25, 2008
Sold by
Safemark Properties Llc
Bought by
Strickland April Leanne
Home Financials for this Owner
Home Financials are based on the most recent Mortgage that was taken out on this home.
Original Mortgage
$62,980
Outstanding Balance
$39,467
Interest Rate
5.85%
Mortgage Type
FHA
Estimated Equity
$86,886
Purchase Details
Closed on
Sep 7, 2007
Sold by
Lambeth Terry Lee and Lambeth Jana
Bought by
Safemark Properties Llc
Purchase Details
Closed on
May 16, 2007
Sold by
Citimortgage Inc
Bought by
Lambeth Terry Lee and Dodd James L
Purchase Details
Closed on
Feb 5, 2007
Sold by
Little Deborah E
Bought by
Citimortgage Inc
Create a Home Valuation Report for This Property
The Home Valuation Report is an in-depth analysis detailing your home's value as well as a comparison with similar homes in the area
Home Values in the Area
Average Home Value in this Area
Purchase History
| Date | Buyer | Sale Price | Title Company |
|---|---|---|---|
| Phillips William Lee | -- | None Available | |
| Strickland April Leanne | $63,500 | None Available | |
| Safemark Properties Llc | -- | None Available | |
| Lambeth Terry Lee | $17,000 | None Available | |
| Citimortgage Inc | $23,900 | None Available |
Source: Public Records
Mortgage History
| Date | Status | Borrower | Loan Amount |
|---|---|---|---|
| Open | Strickland April Leanne | $62,980 |
Source: Public Records
Tax History
| Year | Tax Paid | Tax Assessment Tax Assessment Total Assessment is a certain percentage of the fair market value that is determined by local assessors to be the total taxable value of land and additions on the property. | Land | Improvement |
|---|---|---|---|---|
| 2025 | $623 | $45,200 | $7,000 | $38,200 |
| 2024 | $623 | $45,200 | $7,000 | $38,200 |
| 2023 | $623 | $45,200 | $7,000 | $38,200 |
| 2022 | $609 | $45,200 | $7,000 | $38,200 |
| 2021 | $550 | $39,900 | $6,000 | $33,900 |
| 2020 | $550 | $39,900 | $6,000 | $33,900 |
| 2019 | $550 | $39,900 | $0 | $0 |
| 2018 | $547 | $39,900 | $0 | $0 |
| 2017 | $550 | $39,900 | $0 | $0 |
| 2016 | $611 | $43,600 | $0 | $0 |
| 2015 | $615 | $43,600 | $0 | $0 |
| 2014 | $625 | $43,600 | $0 | $0 |
Source: Public Records
Map
Nearby Homes
- 650 Wesley Dr
- 640 Wesley Dr
- 1914 E Russell Ave
- 1103 Jefferson St
- 1012 Jefferson St
- 1110 Worth St
- 1422 Valley Ridge Dr
- 1314 Franklin Ave
- 1111 Winslow St
- 1806 Franklin Ave
- 812 E Russell Ave
- 1809 Franklin Ave
- 1010 Grace St
- 1114 Richland St
- 1423 E Commerce Ave
- 1021 Asheboro St
- 705 Wise Ave
- 909 Randolph St
- 335 Nathan Hunt Dr
- 925 Randolph St
Your Personal Tour Guide
Ask me questions while you tour the home.