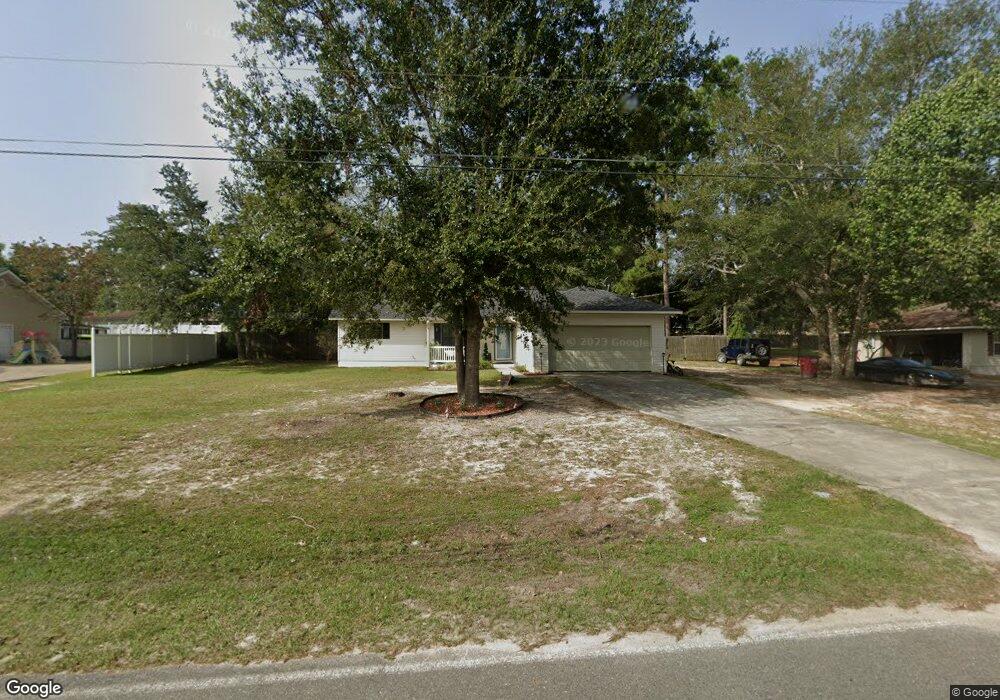
904 Azalea St Blackshear, GA 31516
Estimated Value: $207,000 - $242,000
3
Beds
2
Baths
1,352
Sq Ft
$162/Sq Ft
Est. Value
About This Home
This home is located at 904 Azalea St, Blackshear, GA 31516 and is currently estimated at $219,173, approximately $162 per square foot. 904 Azalea St is a home located in Pierce County with nearby schools including Pierce County High School, Southeast Christian Academy, and Truth Christian Academy.
Ownership History
Date
Name
Owned For
Owner Type
Purchase Details
Closed on
Oct 28, 2011
Sold by
Glr 1994 Llc
Bought by
Handley Candace and Handley Jason
Current Estimated Value
Home Financials for this Owner
Home Financials are based on the most recent Mortgage that was taken out on this home.
Original Mortgage
$87,755
Outstanding Balance
$59,383
Interest Rate
4.09%
Mortgage Type
New Conventional
Estimated Equity
$159,790
Purchase Details
Closed on
Feb 8, 2008
Sold by
Cornett Tommy
Bought by
Glr 1994 Llc
Purchase Details
Closed on
Dec 11, 2003
Sold by
Holland Roger S and Mi Suk
Bought by
Tyre Dana and Tommy Cornett
Purchase Details
Closed on
May 16, 2003
Sold by
Holland Roger S
Bought by
Holland Mi Suk
Purchase Details
Closed on
Jul 11, 1997
Sold by
Cedar Hills Trust
Bought by
Holland Roger S and Mi Suk
Purchase Details
Closed on
Mar 25, 1983
Sold by
Peoples Bank
Bought by
Dixon Dennis
Purchase Details
Closed on
Dec 8, 1980
Sold by
Pierce Development Company Inc
Bought by
Peoples Bank
Create a Home Valuation Report for This Property
The Home Valuation Report is an in-depth analysis detailing your home's value as well as a comparison with similar homes in the area
Home Values in the Area
Average Home Value in this Area
Purchase History
| Date | Buyer | Sale Price | Title Company |
|---|---|---|---|
| Handley Candace | $86,000 | -- | |
| Glr 1994 Llc | $100,000 | -- | |
| Tyre Dana | $78,000 | -- | |
| Holland Mi Suk | -- | -- | |
| Holland Roger S | $62,200 | -- | |
| Dixon Dennis | $158,700 | -- | |
| Peoples Bank | -- | -- |
Source: Public Records
Mortgage History
| Date | Status | Borrower | Loan Amount |
|---|---|---|---|
| Open | Handley Candace | $87,755 |
Source: Public Records
Tax History
| Year | Tax Paid | Tax Assessment Tax Assessment Total Assessment is a certain percentage of the fair market value that is determined by local assessors to be the total taxable value of land and additions on the property. | Land | Improvement |
|---|---|---|---|---|
| 2025 | $2,086 | $68,281 | $12,000 | $56,281 |
| 2024 | $2,086 | $66,940 | $12,000 | $54,940 |
| 2023 | $2,127 | $66,332 | $12,000 | $54,332 |
| 2022 | $1,505 | $39,616 | $3,472 | $36,144 |
| 2021 | $1,557 | $38,084 | $3,472 | $34,612 |
| 2020 | $1,514 | $36,553 | $3,472 | $33,081 |
| 2019 | $1,514 | $36,553 | $3,472 | $33,081 |
| 2018 | $1,454 | $35,022 | $3,472 | $31,550 |
| 2017 | $1,420 | $34,103 | $3,472 | $30,631 |
| 2016 | $1,417 | $34,103 | $3,472 | $30,631 |
| 2015 | $1,317 | $34,102 | $3,472 | $30,631 |
| 2014 | $1,317 | $34,102 | $3,472 | $30,631 |
| 2013 | $1,317 | $34,102 | $3,471 | $30,630 |
Source: Public Records
Map
Nearby Homes
- 933 Azalea St
- 918 Main St
- 222 Edgewood Dr
- 622 E Main St
- 1120 Lakeview Dr
- 106 Pinehurst Dr
- ST. ROUTE 121 Georgia 121
- 118 Pinehurst Dr
- 1120 College Ave
- 420 Greenleaf St
- 915 Jane St
- 331 Central Ave W
- 854 Jenkins St
- 517 Lazy Ln
- 5628 Bay Ln
- 420 Jackson St
- 4023 Redstone Cir
- 121 Beaver Dr
- 594 Pinehurst Dr
- 121 Trapper Trail
Your Personal Tour Guide
Ask me questions while you tour the home.