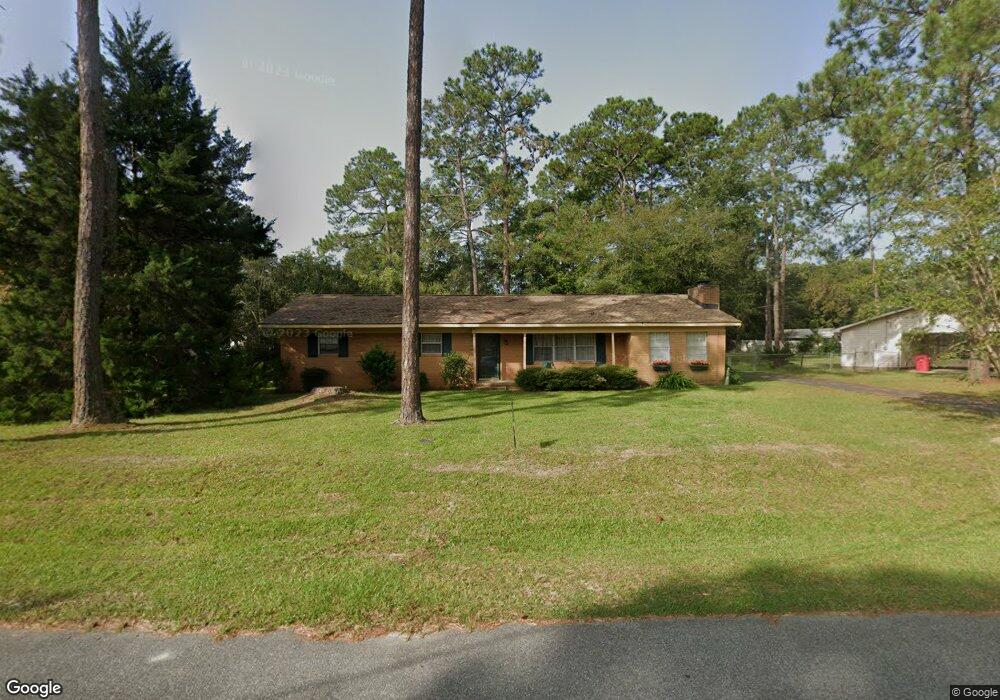
904 Burney Branch Cir Blackshear, GA 31516
Estimated Value: $101,384 - $161,000
3
Beds
2
Baths
1,610
Sq Ft
$80/Sq Ft
Est. Value
About This Home
This home is located at 904 Burney Branch Cir, Blackshear, GA 31516 and is currently estimated at $129,346, approximately $80 per square foot. 904 Burney Branch Cir is a home located in Pierce County with nearby schools including Pierce County High School.
Ownership History
Date
Name
Owned For
Owner Type
Purchase Details
Closed on
Jan 15, 2025
Sold by
Williams Hayes T
Bought by
Putinta Allison W
Current Estimated Value
Purchase Details
Closed on
Sep 25, 2023
Sold by
Williams Karen Livington
Bought by
Williams Hayes T
Purchase Details
Closed on
Feb 5, 2002
Sold by
Prudential Residential Service
Bought by
Williams Karen L
Purchase Details
Closed on
May 3, 1995
Sold by
Robert Charlotte C
Bought by
Tweedy Rodney J and Tweedy Ann M
Purchase Details
Closed on
May 24, 1990
Sold by
Dasher Susan H
Bought by
Courson Charlotte Cruz
Purchase Details
Closed on
Apr 30, 1987
Sold by
Jones Wilburn D and Jones Linda R
Bought by
Dasher Susan H
Purchase Details
Closed on
Dec 26, 1975
Sold by
Whitaker Donald S and Whitaker Barbara K
Bought by
Jones Wilburn D and Jones Linda R
Purchase Details
Closed on
Sep 7, 1973
Sold by
Duff Duff F and Duff Marilyn M
Bought by
Dixon Dixon F and Dixon Elizabeth T
Purchase Details
Closed on
Dec 7, 1972
Sold by
Russell Carroll
Bought by
Duff Duff F and Duff Marilyn M
Create a Home Valuation Report for This Property
The Home Valuation Report is an in-depth analysis detailing your home's value as well as a comparison with similar homes in the area
Home Values in the Area
Average Home Value in this Area
Purchase History
| Date | Buyer | Sale Price | Title Company |
|---|---|---|---|
| Putinta Allison W | $100,000 | -- | |
| Williams Hayes T | -- | -- | |
| Williams Karen L | $55,000 | -- | |
| Prudential Residential Services Ltd | $55,000 | -- | |
| Tweedy Rodney J | $45,000 | -- | |
| Courson Charlotte Cruz | $43,000 | -- | |
| Dasher Susan H | $38,000 | -- | |
| Jones Wilburn D | -- | -- | |
| Dixon Dixon F | -- | -- | |
| Duff Duff F | -- | -- |
Source: Public Records
Tax History Compared to Growth
Tax History
| Year | Tax Paid | Tax Assessment Tax Assessment Total Assessment is a certain percentage of the fair market value that is determined by local assessors to be the total taxable value of land and additions on the property. | Land | Improvement |
|---|---|---|---|---|
| 2024 | $1,851 | $57,708 | $6,000 | $51,708 |
| 2023 | $1,797 | $56,033 | $6,000 | $50,033 |
| 2022 | $1,497 | $39,414 | $5,700 | $33,714 |
| 2021 | $1,553 | $37,986 | $5,700 | $32,286 |
| 2020 | $1,514 | $36,557 | $5,700 | $30,857 |
| 2019 | $1,514 | $36,557 | $5,700 | $30,857 |
| 2018 | $1,459 | $35,128 | $5,700 | $29,428 |
| 2017 | $1,427 | $34,272 | $5,700 | $28,572 |
| 2016 | $1,424 | $34,272 | $5,700 | $28,572 |
| 2015 | $1,233 | $34,271 | $5,700 | $28,572 |
| 2014 | $1,233 | $34,271 | $5,700 | $28,572 |
| 2013 | $1,233 | $34,271 | $5,699 | $28,571 |
Source: Public Records
Map
Nearby Homes
- 930 Burney Branch Cir
- 1114 Laurel St
- 113 Tatum Ln
- 1207 College Ave
- 1120 College Ave
- 118 Pinehurst Dr
- 936 Azalea St
- 933 Azalea St
- 209 Woodlawn Terrace
- 915 Jane St
- 111 Cedar Ln
- 4023 Maple Rd
- 622 E Main St
- 5605 Ga Highway 121
- 854 Jenkins St
- 835 Azalea St
- 706 Jenkins St
- 0001 Georgia 121
- ST. ROUTE 121 Georgia 121
- 3930 Golfview Dr
- 900 Burney Branch Cir
- 916 Burney Branch Cir
- 222 Edgewood Dr
- 911 Burney Branch Cir
- 209 Glenwood Dr
- 205 Glenwood Dr
- 219 Glenwood Dr
- 921 Burney Branch Cir
- 214 Edgewood Dr
- 233 Glenwood Dr
- 324 Edgewood Dr
- 335 Edgewood Dr
- 328 Edgewood Dr
- 320 Edgewood Dr
- 937 Briarcliffe Ln
- 935 Burney Branch Cir
- 935 Burney Branch Cir
- 937 Briarcliffe Ln
- 919 Briarcliffe Ln
- 316 Edgewood Dr