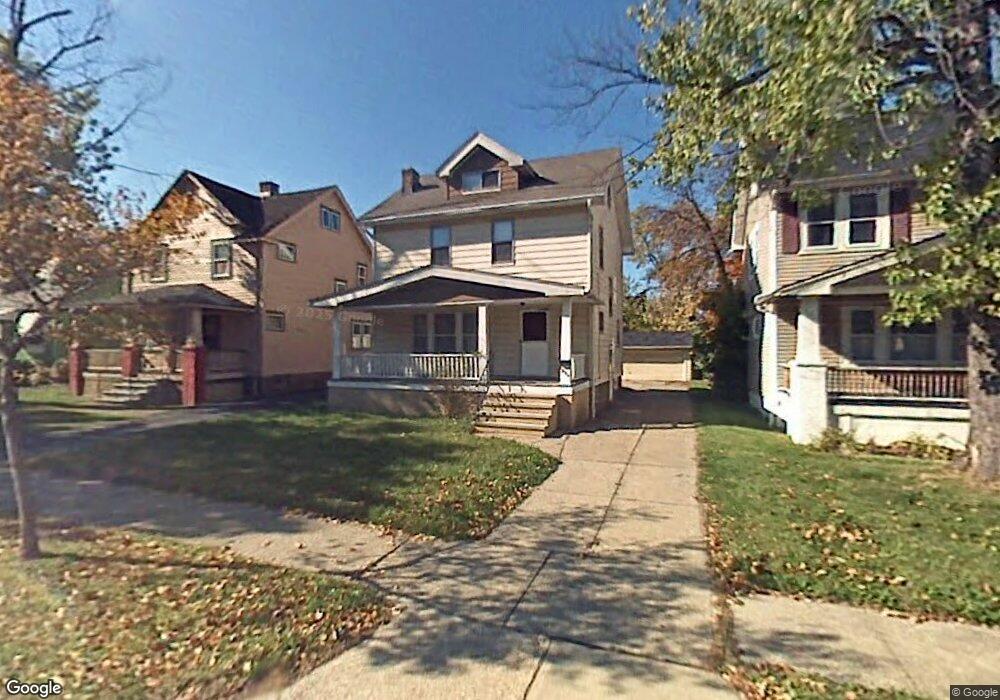
904 Greyton Rd Cleveland, OH 44112
Monticello-Noble NeighborhoodEstimated Value: $128,889 - $150,000
4
Beds
1
Bath
1,266
Sq Ft
$108/Sq Ft
Est. Value
About This Home
This home is located at 904 Greyton Rd, Cleveland, OH 44112 and is currently estimated at $136,972, approximately $108 per square foot. 904 Greyton Rd is a home located in Cuyahoga County with nearby schools including A.C. Jones Health Professions Magnet Academy, Shaw High School, and Apex Academy.
Ownership History
Date
Name
Owned For
Owner Type
Purchase Details
Closed on
Jul 25, 2003
Sold by
Williams Irene D and Williams Madison
Bought by
Darden Anthony L and Dyson Bernice I
Current Estimated Value
Home Financials for this Owner
Home Financials are based on the most recent Mortgage that was taken out on this home.
Original Mortgage
$85,404
Outstanding Balance
$36,419
Interest Rate
5.3%
Mortgage Type
Purchase Money Mortgage
Estimated Equity
$100,553
Purchase Details
Closed on
Sep 3, 1992
Sold by
Brown Charles
Bought by
Daugherty Irene D
Purchase Details
Closed on
Aug 18, 1992
Sold by
Brown Charles and Brown Margaret
Bought by
Brown Charles
Purchase Details
Closed on
Jan 17, 1984
Sold by
Madison Charles M
Bought by
Brown Charles and Brown Margaret
Purchase Details
Closed on
Jan 18, 1978
Sold by
Phillips Jerry M and E L
Bought by
Madison Charles M
Purchase Details
Closed on
Jan 1, 1975
Bought by
Phillips Jerry M and E L
Create a Home Valuation Report for This Property
The Home Valuation Report is an in-depth analysis detailing your home's value as well as a comparison with similar homes in the area
Home Values in the Area
Average Home Value in this Area
Purchase History
| Date | Buyer | Sale Price | Title Company |
|---|---|---|---|
| Darden Anthony L | $89,900 | Revere Title | |
| Daugherty Irene D | $50,000 | -- | |
| Brown Charles | -- | -- | |
| Brown Charles | $41,000 | -- | |
| Madison Charles M | $25,800 | -- | |
| Phillips Jerry M | -- | -- |
Source: Public Records
Mortgage History
| Date | Status | Borrower | Loan Amount |
|---|---|---|---|
| Open | Darden Anthony L | $85,404 |
Source: Public Records
Tax History Compared to Growth
Tax History
| Year | Tax Paid | Tax Assessment Tax Assessment Total Assessment is a certain percentage of the fair market value that is determined by local assessors to be the total taxable value of land and additions on the property. | Land | Improvement |
|---|---|---|---|---|
| 2024 | $2,664 | $43,365 | $7,665 | $35,700 |
| 2023 | $2,285 | $26,740 | $3,570 | $23,170 |
| 2022 | $2,378 | $26,740 | $3,570 | $23,170 |
| 2021 | $2,257 | $26,740 | $3,570 | $23,170 |
| 2020 | $2,209 | $24,080 | $3,220 | $20,860 |
| 2019 | $2,316 | $68,800 | $9,200 | $59,600 |
| 2018 | $2,145 | $24,080 | $3,220 | $20,860 |
| 2017 | $2,005 | $22,090 | $4,240 | $17,850 |
| 2016 | $2,018 | $21,740 | $4,240 | $17,500 |
| 2015 | $2,194 | $21,740 | $4,240 | $17,500 |
| 2014 | $2,194 | $26,180 | $5,110 | $21,070 |
Source: Public Records
Map
Nearby Homes
- 907 Nela View Rd
- 916 Whitby Rd
- 885 Helmsdale Rd
- 839 Nela View Rd
- 841 Helmsdale Rd
- 931 Helmsdale Rd
- 833 Nela View Rd
- 939 Helmsdale Rd
- 825 Helmsdale Rd
- 828 Nela View Rd
- 965 Whitby Rd
- 861 Caledonia Ave
- 817 Helmsdale Rd
- 901 Woodview Rd
- 877 Woodview Rd Unit 101
- 935 Ravine Dr
- 991 Helmsdale Rd
- 16208 Greyton Rd
- 3451 Hartwood Rd
- 945 Dresden Rd
- 900 Greyton Rd
- 908 Greyton Rd
- 912 Greyton Rd
- 896 Greyton Rd
- 895 Nela View Rd
- 891 Nela View Rd
- 894 Greyton Rd
- 914 Greyton Rd
- 916 Greyton Rd
- 899 Nela View Rd
- 887 Nela View Rd
- 903 Nela View Rd
- 885 Nela View Rd
- 888 Greyton Rd
- 920 Greyton Rd
- 895 Greyton Rd
- 912 Whitby Rd
- 881 Nela View Rd
- 913 Greyton Rd
- 891 Greyton Rd