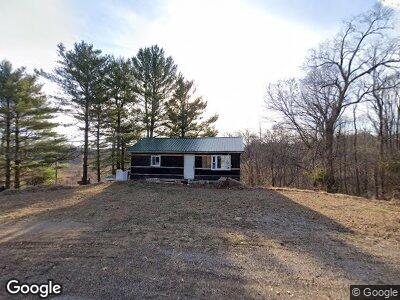
904 Jim Lackey Rd Thurman, OH 45685
Estimated Value: $99,513 - $142,000
1
Bed
1
Bath
1,168
Sq Ft
$104/Sq Ft
Est. Value
About This Home
This home is located at 904 Jim Lackey Rd, Thurman, OH 45685 and is currently estimated at $121,128, approximately $103 per square foot. 904 Jim Lackey Rd is a home located in Jackson County with nearby schools including Oak Hill Elementary School and Oak Hill Middle/High School.
Ownership History
Date
Name
Owned For
Owner Type
Purchase Details
Closed on
Nov 9, 2023
Sold by
Williams Keith L and Williams Jessica M
Bought by
Williams Jeremy Scott
Current Estimated Value
Purchase Details
Closed on
Mar 19, 2021
Sold by
Mcgrath Susan R
Bought by
Williams Keith L and Williams Jessica M
Purchase Details
Closed on
Aug 21, 2009
Sold by
Wells Fargo Bank Na
Bought by
Mcgrath Susan R
Purchase Details
Closed on
Jun 18, 2009
Sold by
Tincher Edward
Bought by
Wells Fargo Bank Na
Purchase Details
Closed on
Jun 27, 2001
Sold by
Silvey Timothy L and Silvey Rita J
Bought by
Tincher Edward
Purchase Details
Closed on
Apr 15, 1999
Sold by
Evans David W
Bought by
Silvey Timothy L and Silvey Rita J
Purchase Details
Closed on
Mar 23, 1998
Sold by
Evans David W
Bought by
Evans David W
Purchase Details
Closed on
Jul 27, 1995
Sold by
Prater Patty L
Bought by
Evans David W
Create a Home Valuation Report for This Property
The Home Valuation Report is an in-depth analysis detailing your home's value as well as a comparison with similar homes in the area
Home Values in the Area
Average Home Value in this Area
Purchase History
| Date | Buyer | Sale Price | Title Company |
|---|---|---|---|
| Williams Jeremy Scott | -- | None Listed On Document | |
| Williams Keith L | $20,000 | None Available | |
| Mcgrath Susan R | $9,000 | None Available | |
| Wells Fargo Bank Na | $40,509 | None Available | |
| Tincher Edward | $43,500 | -- | |
| Silvey Timothy L | $35,000 | -- | |
| Evans David W | $35,000 | -- | |
| Evans David W | $32,000 | -- |
Source: Public Records
Tax History Compared to Growth
Tax History
| Year | Tax Paid | Tax Assessment Tax Assessment Total Assessment is a certain percentage of the fair market value that is determined by local assessors to be the total taxable value of land and additions on the property. | Land | Improvement |
|---|---|---|---|---|
| 2024 | $823 | $25,330 | $4,200 | $21,130 |
| 2023 | $823 | $25,330 | $4,200 | $21,130 |
| 2022 | $780 | $19,410 | $4,470 | $14,940 |
| 2021 | $677 | $19,410 | $4,470 | $14,940 |
| 2020 | $3,734 | $19,410 | $4,470 | $14,940 |
| 2019 | $639 | $17,650 | $4,070 | $13,580 |
| 2018 | $617 | $17,650 | $4,070 | $13,580 |
| 2017 | $589 | $17,650 | $4,070 | $13,580 |
| 2016 | $3,679 | $14,970 | $4,040 | $10,930 |
| 2015 | $500 | $14,970 | $4,040 | $10,930 |
| 2013 | $515 | $15,430 | $4,040 | $11,390 |
| 2012 | $1,161 | $15,430 | $4,040 | $11,390 |
Source: Public Records
Map
Nearby Homes
- 123 Smokey Hollow Rd
- 0 Orpheus-Keystone Rd Unit (Solar Cabin at Keys
- 0 Orpheus-Keystone Rd Unit (Tract 5 Caves at Ke
- 0 Deer Creek Rd
- 0 Gravel Valley School Rd
- 0 Kyer Rd
- 1701 Dixon Run Rd
- 614 Ohio 325
- 837 Centerpoint Rd
- 157 Wayne Ln
- 1610 Erwin Rd
- 13916 State Route 279
- 101 E College St
- 37 Pine St
- 0 Sonne-Kolb Rd Unit 5117565
- 7669 Bull Run Rd
- 108 Reed St
- 703 E Main St
- 519 E Main St
- 151 Wastier Cherrington Rd
- 904 Jim Lackey Rd
- 1193 Jim Lackey Rd
- 0 Lackey Rd Unit 9918390
- 1343 Jim Lackey Rd
- 360 Jim Lackey Rd
- 1624 Jim Lackey Rd
- 1601 Jim Lackey Rd
- 1156 Orpheus Rd
- 175 Cardwell Rd
- 1264 Orpheus Rd
- 3263 Carmel Bathamia Rd
- 3033 Carmel Bathamia Rd
- 1561 Jim Lackey Rd
- 1848 Orpheus Rd
- 1612 Orpheus Rd
- 1850 Orpheus Rd
- 1600 Orpheus Rd
- 1470 Orpheus Rd
- 874 Orpheus Rd
- 1472 Orpheus Rd