
Seller's Agent in 2026
Kyle Seyboth
Century 21 Limitless
(401) 415-8527
9 in this area
1,742 Total Sales
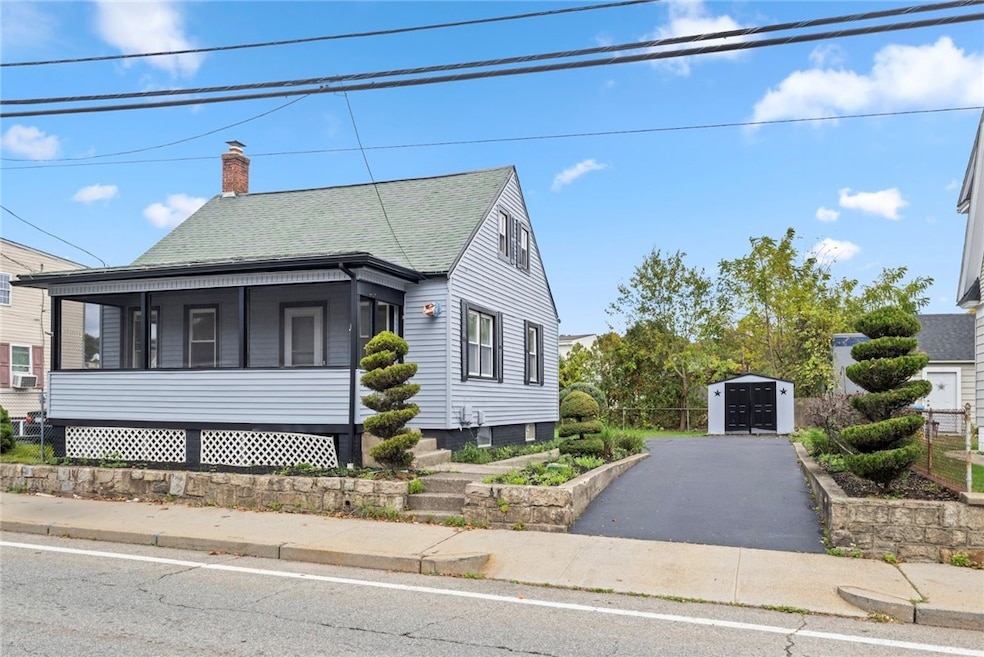
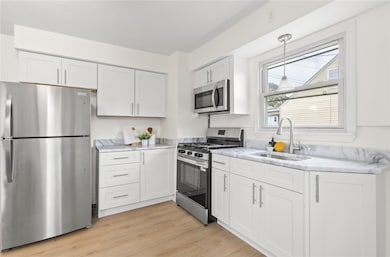
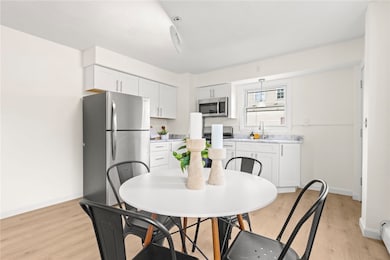
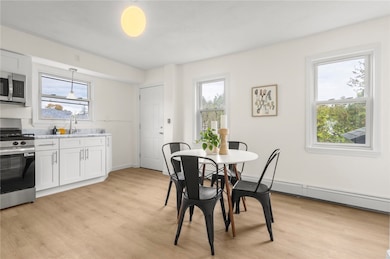

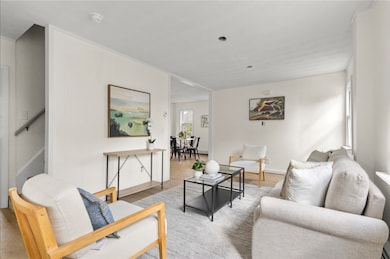
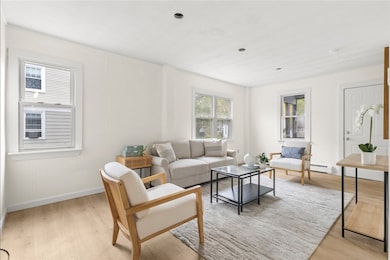
Beautifully renovated single-family home in West Warwick, RI, featuring 3 bedrooms and 1 full bathroom. This stunning home offers a bright and welcoming atmosphere, with plenty of windows that fill the space with natural light. The modern kitchen is equipped with sleek stainless steel appliances and ample cabinet space, perfect for everyday cooking and entertaining. Recent updates include a new furnace, new plumbing, and new electrical, providing peace of mind for years to come. The unfinished basement offers additional storage or future expansion potential. Outside, enjoy a nice yard and a newly paved driveway, adding both charm and convenience. Located in a great area close to major highways, shopping, dining, and local amenities, this property offers an ideal combination of comfort, style, and accessibility. Move-in ready and thoughtfully updated, this West Warwick home is the perfect choice for buyers seeking modern living in a convenient location.
Last Agent to Sell the Property
Century 21 Limitless License #REC.0005226 Listed on: 10/20/2025
| Date | Type | Sale Price | Title Company |
|---|---|---|---|
| Warranty Deed | $360,000 | -- | |
| Warranty Deed | $360,000 | -- | |
| Foreclosure Deed | $235,000 | -- | |
| Foreclosure Deed | $235,000 | -- | |
| Deed | $49,000 | -- | |
| Deed | $87,000 | -- | |
| Warranty Deed | $64,000 | -- |
| Date | Status | Loan Amount | Loan Type |
|---|---|---|---|
| Open | $353,479 | FHA | |
| Closed | $353,479 | FHA | |
| Previous Owner | $285,000 | Purchase Money Mortgage | |
| Previous Owner | $196,200 | No Value Available | |
| Previous Owner | $143,200 | No Value Available |
| Date | Event | Price | List to Sale | Price per Sq Ft |
|---|---|---|---|---|
| 01/02/2026 01/02/26 | Sold | $360,000 | +2.9% | $288 / Sq Ft |
| 11/18/2025 11/18/25 | Pending | -- | -- | -- |
| 11/04/2025 11/04/25 | Price Changed | $350,000 | -5.4% | $280 / Sq Ft |
| 11/01/2025 11/01/25 | Price Changed | $369,900 | -1.4% | $296 / Sq Ft |
| 10/20/2025 10/20/25 | For Sale | $375,000 | -- | $300 / Sq Ft |
| Year | Tax Paid | Tax Assessment Tax Assessment Total Assessment is a certain percentage of the fair market value that is determined by local assessors to be the total taxable value of land and additions on the property. | Land | Improvement |
|---|---|---|---|---|
| 2025 | $3,200 | $223,900 | $67,900 | $156,000 |
| 2024 | $3,620 | $193,700 | $64,100 | $129,600 |
| 2023 | $3,549 | $193,700 | $64,100 | $129,600 |
| 2022 | $3,494 | $193,700 | $64,100 | $129,600 |
| 2021 | $3,554 | $154,500 | $49,000 | $105,500 |
| 2020 | $3,554 | $154,500 | $49,000 | $105,500 |
| 2019 | $4,530 | $154,500 | $49,000 | $105,500 |
| 2018 | $2,935 | $108,000 | $42,200 | $65,800 |
| 2017 | $2,841 | $108,000 | $42,200 | $65,800 |
| 2016 | $2,791 | $108,000 | $42,200 | $65,800 |
| 2015 | $2,718 | $104,700 | $42,200 | $62,500 |
| 2014 | $2,658 | $104,700 | $42,200 | $62,500 |
Seller's Agent in 2026
Kyle Seyboth
Century 21 Limitless
(401) 415-8527
9 in this area
1,742 Total Sales
T
Buyer's Agent in 2026
Tayla Westgate
Keller Williams South Watuppa
(774) 361-2472
1 in this area
9 Total Sales
Source: State-Wide MLS
MLS Number: 1398113
APN: WWAR-000003-000221-000000
Disclaimer: Certain information contained herein is derived from information provided by parties other than Homes.com. All information provided is deemed reliable, but is not guaranteed to be accurate and should be independently verified.
![]() IDX information is provided exclusively for personal, non-commercial use, and may not be used for any purpose other than to identify prospective properties consumers may be interested in purchasing. Information is deemed reliable but not guaranteed.
IDX information is provided exclusively for personal, non-commercial use, and may not be used for any purpose other than to identify prospective properties consumers may be interested in purchasing. Information is deemed reliable but not guaranteed.
Copyright © 2026 State-Wide MLS, Inc. All rights reserved.
Ask me questions while you tour the home.