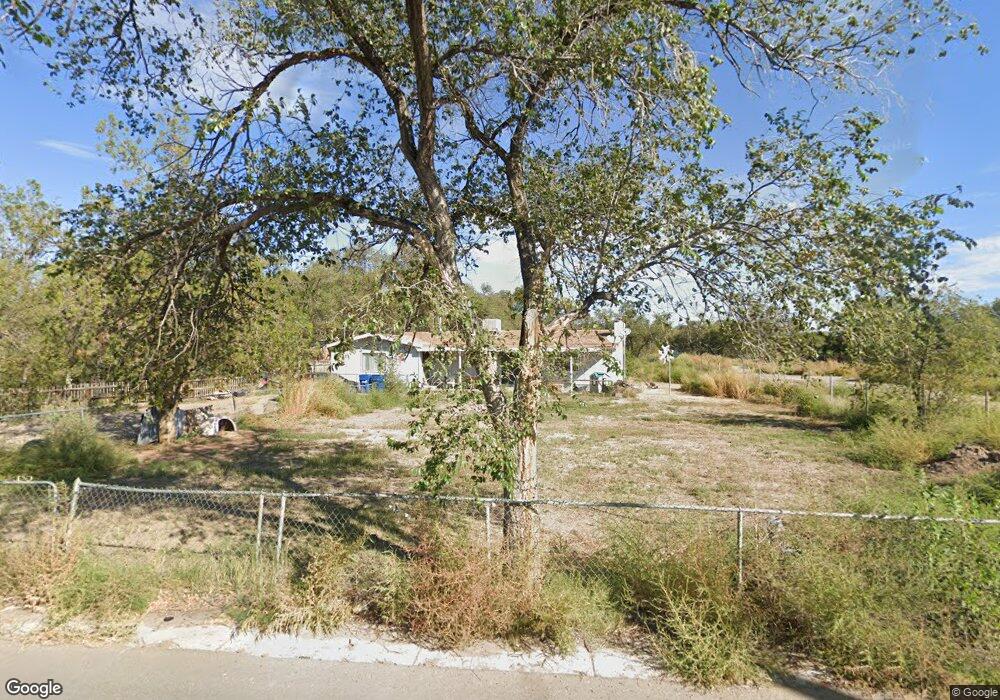
904 Rivas Rd Los Lunas, NM 87031
Estimated Value: $330,000 - $424,000
3
Beds
2
Baths
1,998
Sq Ft
$192/Sq Ft
Est. Value
About This Home
This home is located at 904 Rivas Rd, Los Lunas, NM 87031 and is currently estimated at $383,238, approximately $191 per square foot. 904 Rivas Rd is a home located in Valencia County with nearby schools including Los Lunas Elementary School, Los Lunas Middle School, and Los Lunas High School.
Ownership History
Date
Name
Owned For
Owner Type
Purchase Details
Closed on
Feb 28, 2025
Sold by
Franco Michael and Franco Leslie
Bought by
Owen Debra
Current Estimated Value
Home Financials for this Owner
Home Financials are based on the most recent Mortgage that was taken out on this home.
Original Mortgage
$153,292
Outstanding Balance
$152,533
Interest Rate
7.04%
Mortgage Type
New Conventional
Estimated Equity
$230,705
Purchase Details
Closed on
Jun 25, 2018
Sold by
Duke City Heating & Cooling Llc
Bought by
Franco Michael and Franco Leslie
Home Financials for this Owner
Home Financials are based on the most recent Mortgage that was taken out on this home.
Original Mortgage
$85,000
Interest Rate
4.6%
Mortgage Type
New Conventional
Purchase Details
Closed on
Sep 2, 2014
Sold by
Lovato Josh S
Bought by
Duke City Heating And Cooling Llc
Purchase Details
Closed on
May 11, 2007
Sold by
Perry Jerry G
Bought by
Lovato Joshua S
Create a Home Valuation Report for This Property
The Home Valuation Report is an in-depth analysis detailing your home's value as well as a comparison with similar homes in the area
Home Values in the Area
Average Home Value in this Area
Purchase History
| Date | Buyer | Sale Price | Title Company |
|---|---|---|---|
| Owen Debra | -- | Old Republic National Title In | |
| Franco Michael | -- | Old Republic Natl Ins Co | |
| Duke City Heating And Cooling Llc | -- | None Available | |
| Lovato Joshua S | -- | None Available | |
| Lovato Joshua S | -- | None Available |
Source: Public Records
Mortgage History
| Date | Status | Borrower | Loan Amount |
|---|---|---|---|
| Open | Owen Debra | $153,292 | |
| Previous Owner | Franco Michael | $85,000 |
Source: Public Records
Tax History Compared to Growth
Tax History
| Year | Tax Paid | Tax Assessment Tax Assessment Total Assessment is a certain percentage of the fair market value that is determined by local assessors to be the total taxable value of land and additions on the property. | Land | Improvement |
|---|---|---|---|---|
| 2024 | $1,590 | $40,594 | $6,178 | $34,416 |
| 2023 | $1,536 | $39,411 | $6,178 | $33,233 |
| 2022 | $1,469 | $38,264 | $6,178 | $32,086 |
| 2021 | $1,438 | $37,149 | $6,363 | $30,786 |
| 2020 | $1,419 | $36,067 | $6,178 | $29,889 |
| 2019 | $1,385 | $35,017 | $6,178 | $28,839 |
| 2018 | $1,364 | $35,017 | $6,178 | $28,839 |
| 2017 | $1,271 | $35,017 | $6,178 | $28,839 |
| 2016 | $1,264 | $35,017 | $6,178 | $28,839 |
| 2015 | -- | $35,017 | $6,178 | $28,839 |
| 2013 | -- | $30,597 | $6,178 | $24,419 |
| 2011 | -- | $89,118 | $17,994 | $71,124 |
Source: Public Records
Map
Nearby Homes
- 612 Calle Don Demetrio NE
- 0 Cinder Ln
- 427 Kingsbury Cir NE
- 466 Dennis Ct NE
- 500 Calle de Wences
- 403 Dennis Dr NE
- 360 Taylor Rd NE
- 215 Tren Rd
- 0 Rio Del Oro: Lot: 40 Unit 12 1073698
- 235 Luna Ave NE
- 414 Adeline Ave SW
- 435 Adeline Ave SW
- 126 Joseph Ct
- 344 Los Lentes Rd SE
- 0 Main St NE
- Payson Plan at Villa De Marcos Gabriel
- 461 Los Lentes Rd SE
- 251 Trujillo St NE
- 1160 Pine Ct SE
- 411 Schmidt Place SW
- 822 Rivas Rd
- 903 Rivas Rd
- 930 Rivas Rd
- 812 Rivas Rd
- 779 Rositas Ln NE
- 781 Onesimo Fajardo Ln
- 509 Diana Dr
- 517 Diana Dr
- 761 Onesimo Fajardo Ln NE
- 1000 Rivas Rd
- 726 Rivas Rd
- 726 Rivas Rd Unit A & B
- 505 Diana Dr
- 521 Diana Dr
- 730 Rivas Rd
- 728 Los Lentes Rd NE
- 738 Los Lentes Rd NE
- 846 Los Lentes Rd NE
- 1036 Rivas Rd
- 501 Diana Dr