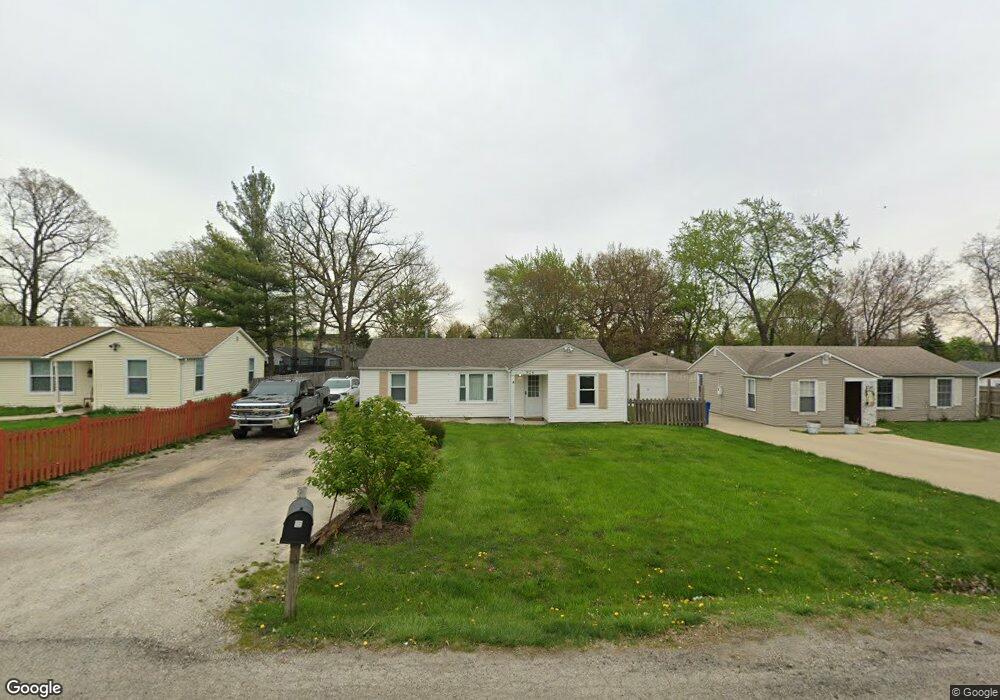
904 S Calhoun St Aurora, IL 60505
South Farnsworth NeighborhoodEstimated Value: $167,000 - $230,000
3
Beds
1
Bath
902
Sq Ft
$221/Sq Ft
Est. Value
About This Home
This home is located at 904 S Calhoun St, Aurora, IL 60505 and is currently estimated at $199,307, approximately $220 per square foot. 904 S Calhoun St is a home located in Kane County with nearby schools including O.C. Allen Elementary School, Henry W Cowherd Middle School, and East Aurora High School.
Ownership History
Date
Name
Owned For
Owner Type
Purchase Details
Closed on
Sep 20, 2011
Sold by
Federal Home Loan Mortgage Corporation
Bought by
Denevarez Ines Soto and Soto Miguel Nevarez
Current Estimated Value
Purchase Details
Closed on
Oct 18, 2010
Sold by
Colon Kevin F
Bought by
Federal Home Loan Mortgage Corp
Purchase Details
Closed on
May 14, 1999
Sold by
Amidei Edwin D and Emidei Cynthia L
Bought by
Colon Kevin and Colon Angela
Home Financials for this Owner
Home Financials are based on the most recent Mortgage that was taken out on this home.
Original Mortgage
$74,335
Interest Rate
6.99%
Mortgage Type
FHA
Purchase Details
Closed on
Dec 18, 1997
Sold by
Sharp Donald W
Bought by
Amidei Edwin D and Amidei Cynthia L
Home Financials for this Owner
Home Financials are based on the most recent Mortgage that was taken out on this home.
Original Mortgage
$64,826
Interest Rate
7.35%
Mortgage Type
FHA
Create a Home Valuation Report for This Property
The Home Valuation Report is an in-depth analysis detailing your home's value as well as a comparison with similar homes in the area
Home Values in the Area
Average Home Value in this Area
Purchase History
| Date | Buyer | Sale Price | Title Company |
|---|---|---|---|
| Denevarez Ines Soto | $36,000 | Attorneys Title Guaranty Fun | |
| Federal Home Loan Mortgage Corp | -- | None Available | |
| Colon Kevin | $74,500 | Law Title Insurance Co Inc | |
| Amidei Edwin D | $65,000 | Law Title Insurance Co Inc |
Source: Public Records
Mortgage History
| Date | Status | Borrower | Loan Amount |
|---|---|---|---|
| Previous Owner | Colon Kevin | $74,335 | |
| Previous Owner | Amidei Edwin D | $64,826 |
Source: Public Records
Tax History Compared to Growth
Tax History
| Year | Tax Paid | Tax Assessment Tax Assessment Total Assessment is a certain percentage of the fair market value that is determined by local assessors to be the total taxable value of land and additions on the property. | Land | Improvement |
|---|---|---|---|---|
| 2024 | $2,536 | $43,819 | $4,077 | $39,742 |
| 2023 | $2,335 | $39,152 | $3,643 | $35,509 |
| 2022 | $2,063 | $34,290 | $3,324 | $30,966 |
| 2021 | $2,053 | $31,925 | $3,095 | $28,830 |
| 2020 | $1,970 | $29,654 | $2,875 | $26,779 |
| 2019 | $1,955 | $27,475 | $2,664 | $24,811 |
| 2018 | $1,937 | $25,906 | $2,464 | $23,442 |
| 2017 | $1,601 | $19,594 | $2,270 | $17,324 |
| 2016 | $1,822 | $20,499 | $1,946 | $18,553 |
| 2015 | -- | $18,165 | $1,673 | $16,492 |
| 2014 | -- | $16,565 | $1,538 | $15,027 |
| 2013 | -- | $18,005 | $1,547 | $16,458 |
Source: Public Records
Map
Nearby Homes
- 859 Symphony Dr Unit 7153
- 990 Celebration Dr
- 863 Symphony Dr Unit 7151
- 836 S Sumner Ave
- 1015 Celebration Dr
- 799 Symphony Dr Unit 8084
- 1636 Linden Park Ln Unit 7078
- 1011 Celebration Dr
- 1003 Celebration Dr
- 1601 Simms St Unit 6386
- 986 Four Seasons Blvd Unit 1
- 888 Serendipity Dr Unit 5
- 734 Four Seasons Blvd Unit 9098
- 1653 Victoria Park Cir Unit A183
- 687 Serendipity Dr Unit 9188
- 675 Serendipity Dr Unit 9182
- 610 Four Seasons Blvd Unit A071
- 1811 Bluestem Cir
- 1853 Westridge Place
- 1825 Bluestem Cir
- 906 S Calhoun St
- 902 S Calhoun St
- 1335 Binder St
- 903 S Farnsworth Ave
- 905 S Farnsworth Ave
- 901 S Farnsworth Ave
- 907 S Farnsworth Ave
- 1348 Binder St
- 910 S Calhoun St
- 903 S Calhoun St
- 901 S Calhoun St
- 911 S Calhoun St
- 909 S Calhoun St
- 1320 Binder St
- 909 S Farnsworth Ave
- 1331 Binder St
- 915 S Calhoun St
- 1347 Binder St
- 100 S Farnsworth Ave
- 836 S Calhoun St