Estimated Value: $178,000 - $248,000
3
Beds
2
Baths
1,207
Sq Ft
$186/Sq Ft
Est. Value
About This Home
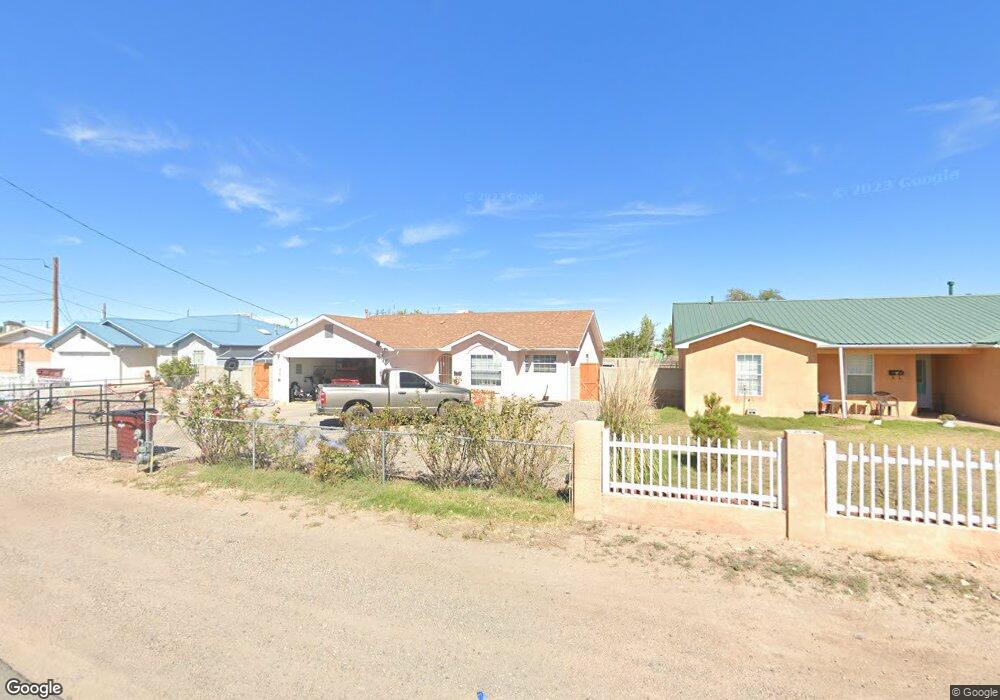
This home is located at 904 W Aragon Rd, Belen, NM 87002 and is currently estimated at $224,144, approximately $185 per square foot. 904 W Aragon Rd is a home located in Valencia County with nearby schools including Belen High School, St. Mary's School, and Canon Christian Academy.
Ownership History
Date
Name
Owned For
Owner Type
Purchase Details
Closed on
Feb 28, 2019
Sold by
Trujillo Jonathan and Trujillo Patricia
Bought by
Cervantes-Quinones Maria
Current Estimated Value
Home Financials for this Owner
Home Financials are based on the most recent Mortgage that was taken out on this home.
Original Mortgage
$135,800
Outstanding Balance
$119,391
Interest Rate
4.4%
Mortgage Type
New Conventional
Estimated Equity
$104,753
Purchase Details
Closed on
Dec 12, 2018
Sold by
Federal National Mortgage Association
Bought by
Trujillo Jonathan
Purchase Details
Closed on
Aug 27, 2018
Sold by
Valencia County
Bought by
Federal National Mortgage Association and Fannie Mae
Purchase Details
Closed on
Oct 26, 2005
Sold by
Mares Gerald M
Bought by
Mares Gerald Mark
Home Financials for this Owner
Home Financials are based on the most recent Mortgage that was taken out on this home.
Original Mortgage
$15,100
Interest Rate
5.29%
Mortgage Type
New Conventional
Create a Home Valuation Report for This Property
The Home Valuation Report is an in-depth analysis detailing your home's value as well as a comparison with similar homes in the area
Home Values in the Area
Average Home Value in this Area
Purchase History
| Date | Buyer | Sale Price | Title Company |
|---|---|---|---|
| Cervantes-Quinones Maria | -- | None Available | |
| Trujillo Jonathan | -- | None Available | |
| Federal National Mortgage Association | -- | None Available | |
| Mares Gerald Mark | -- | Fidelity National Title Co |
Source: Public Records
Mortgage History
| Date | Status | Borrower | Loan Amount |
|---|---|---|---|
| Open | Cervantes-Quinones Maria | $135,800 | |
| Previous Owner | Mares Gerald Mark | $15,100 |
Source: Public Records
Tax History Compared to Growth
Tax History
| Year | Tax Paid | Tax Assessment Tax Assessment Total Assessment is a certain percentage of the fair market value that is determined by local assessors to be the total taxable value of land and additions on the property. | Land | Improvement |
|---|---|---|---|---|
| 2024 | $1,907 | $50,993 | $8,333 | $42,660 |
| 2023 | $1,906 | $49,508 | $8,333 | $41,175 |
| 2022 | $1,778 | $48,066 | $8,583 | $39,483 |
| 2021 | $1,700 | $48,066 | $8,583 | $39,483 |
| 2020 | $1,679 | $46,666 | $8,333 | $38,333 |
| 2019 | $1,432 | $39,853 | $4,633 | $35,220 |
| 2018 | $1,417 | $39,853 | $4,633 | $35,220 |
| 2017 | $1,372 | $38,778 | $4,633 | $34,145 |
| 2016 | $1,316 | $37,649 | $4,633 | $33,016 |
| 2015 | -- | $36,553 | $4,633 | $31,920 |
| 2013 | -- | $34,455 | $4,633 | $29,822 |
| 2011 | -- | $100,353 | $13,494 | $86,859 |
Source: Public Records
Map
Nearby Homes
- 1010 Santa Anita Dr
- 1019 Santa Anita Dr
- 103 Rosedale Cir
- 1014 W Picard Ave
- 200 Garcia Ave
- 410 N Lala St
- 406 N Lala St
- 402 N Lala St
- 911 Impala Dr
- 523 N 4th St
- - Somerset St
- 222 N Main St
- 609 N 3rd St
- 612 N 3rd St
- 1212 W Reinken Ave
- 0 Goebel Ave
- 106 W Ross Ave
- 1603 Ben San Ave
- 0 N 2nd St
- 1205 W Delgado Ave
- 906 W Aragon Rd
- 900 W Aragon Rd
- 908 W Aragon Rd
- 911 Cavalier Ave
- 912 Molina Place
- 910 Molina Place
- 913 Cavalier Ave
- 901 W Aragon Rd
- 9200 Molina Place
- 914 Molina Place
- 919 Cavalier Ave
- 0 Cavalier Ave
- 920 Molina Place
- 918 Molina Place
- 916 Molina Place
- 924 N 10th St
- 925 Cavalier Ave
- 627 Cavalier Ave
- 0 10th St NW Unit 1063468
- 822 W Aragon Rd