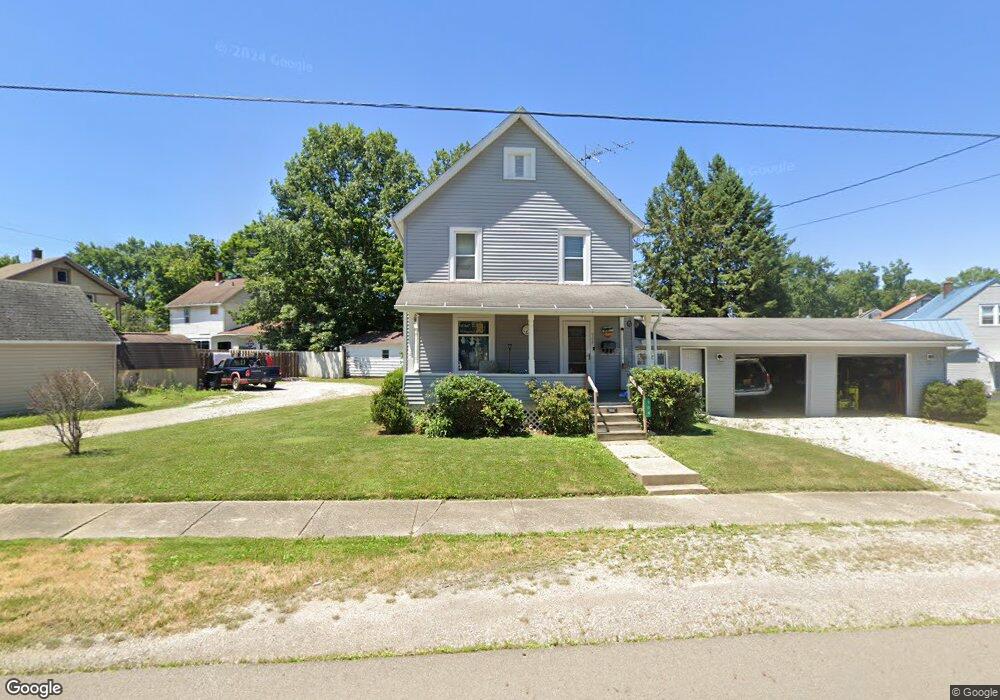
904 Wick Ave Ashland, OH 44805
Estimated Value: $130,770 - $138,000
3
Beds
2
Baths
1,144
Sq Ft
$118/Sq Ft
Est. Value
About This Home
This home is located at 904 Wick Ave, Ashland, OH 44805 and is currently estimated at $135,443, approximately $118 per square foot. 904 Wick Ave is a home located in Ashland County with nearby schools including Ashland High School, Ashland County Community Academy, and St. Edward Elementary School.
Ownership History
Date
Name
Owned For
Owner Type
Purchase Details
Closed on
Apr 28, 2023
Sold by
Turner Jason R and Turner Lisa A
Bought by
Turner Jeremy R
Current Estimated Value
Home Financials for this Owner
Home Financials are based on the most recent Mortgage that was taken out on this home.
Original Mortgage
$91,805
Outstanding Balance
$89,252
Interest Rate
6.39%
Mortgage Type
FHA
Estimated Equity
$46,191
Purchase Details
Closed on
Jan 1, 1990
Bought by
Turner Jason R
Create a Home Valuation Report for This Property
The Home Valuation Report is an in-depth analysis detailing your home's value as well as a comparison with similar homes in the area
Home Values in the Area
Average Home Value in this Area
Purchase History
| Date | Buyer | Sale Price | Title Company |
|---|---|---|---|
| Turner Jeremy R | -- | 20/20 Title Llc | |
| Turner Jason R | -- | -- |
Source: Public Records
Mortgage History
| Date | Status | Borrower | Loan Amount |
|---|---|---|---|
| Open | Turner Jeremy R | $91,805 |
Source: Public Records
Tax History Compared to Growth
Tax History
| Year | Tax Paid | Tax Assessment Tax Assessment Total Assessment is a certain percentage of the fair market value that is determined by local assessors to be the total taxable value of land and additions on the property. | Land | Improvement |
|---|---|---|---|---|
| 2024 | $1,268 | $36,700 | $9,090 | $27,610 |
| 2023 | $1,268 | $36,700 | $9,090 | $27,610 |
| 2022 | $1,192 | $26,600 | $6,590 | $20,010 |
| 2021 | $1,197 | $26,600 | $6,590 | $20,010 |
| 2020 | $1,136 | $26,600 | $6,590 | $20,010 |
| 2019 | $1,114 | $24,160 | $6,550 | $17,610 |
| 2018 | $1,124 | $24,160 | $6,550 | $17,610 |
| 2017 | $1,072 | $24,160 | $6,550 | $17,610 |
| 2016 | $1,072 | $21,960 | $5,950 | $16,010 |
| 2015 | $1,063 | $21,960 | $5,950 | $16,010 |
| 2013 | $1,218 | $24,760 | $5,930 | $18,830 |
Source: Public Records
Map
Nearby Homes