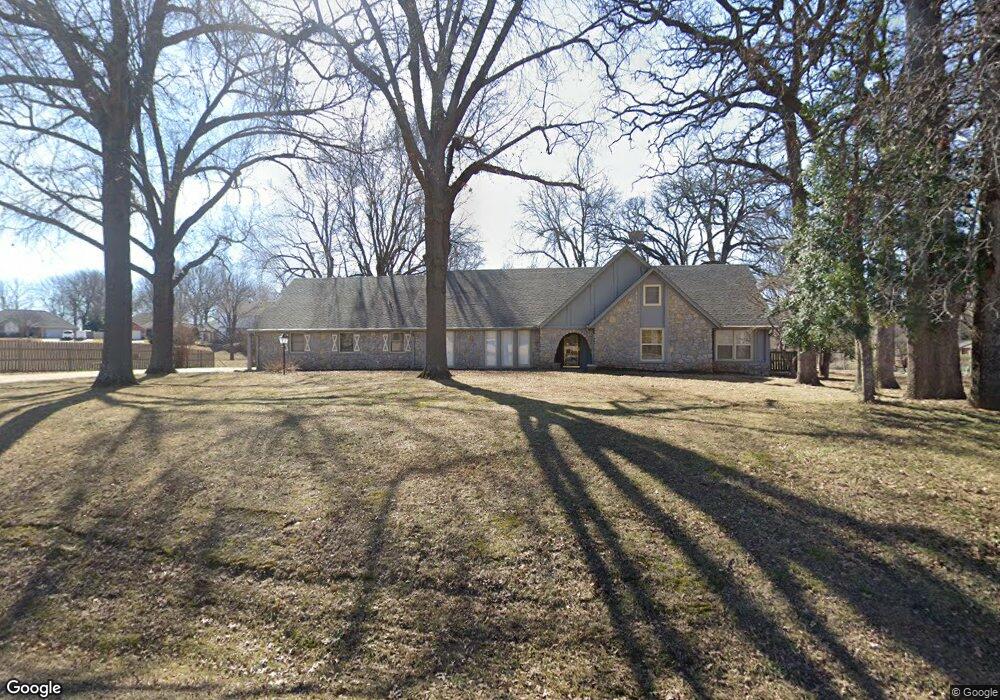
9040 E 111th St S Bixby, OK 74008
North Bixby NeighborhoodEstimated Value: $377,915 - $474,000
Studio
10
Baths
3,647
Sq Ft
$122/Sq Ft
Est. Value
About This Home
This home is located at 9040 E 111th St S, Bixby, OK 74008 and is currently estimated at $445,729, approximately $122 per square foot. 9040 E 111th St S is a home located in Tulsa County with nearby schools including Bixby North Elementary, Bixby North Intermediate, and Bixby Middle School.
Ownership History
Date
Name
Owned For
Owner Type
Purchase Details
Closed on
Jan 8, 2024
Sold by
Billie R Shoemake Revocable Trust
Bought by
Edward D Shoemake Revocable Trust
Current Estimated Value
Purchase Details
Closed on
Oct 31, 2000
Sold by
Shoemake Edward D and Shoemake Billie R
Bought by
Billie R Shoemake Revocable Trust
Home Financials for this Owner
Home Financials are based on the most recent Mortgage that was taken out on this home.
Original Mortgage
$40,000
Interest Rate
7.87%
Mortgage Type
Purchase Money Mortgage
Purchase Details
Closed on
Oct 24, 2000
Sold by
Wilson Judith E
Bought by
Shoemake Edward D and Shoemake Billie R
Home Financials for this Owner
Home Financials are based on the most recent Mortgage that was taken out on this home.
Original Mortgage
$40,000
Interest Rate
7.87%
Mortgage Type
Purchase Money Mortgage
Create a Home Valuation Report for This Property
The Home Valuation Report is an in-depth analysis detailing your home's value as well as a comparison with similar homes in the area
Home Values in the Area
Average Home Value in this Area
Purchase History
| Date | Buyer | Sale Price | Title Company |
|---|---|---|---|
| Edward D Shoemake Revocable Trust | -- | None Listed On Document | |
| Billie R Shoemake Revocable Trust | -- | -- | |
| Shoemake Edward D | $156,500 | Tulsa Abstract & Title Co |
Source: Public Records
Mortgage History
| Date | Status | Borrower | Loan Amount |
|---|---|---|---|
| Previous Owner | Shoemake Edward D | $40,000 | |
| Closed | Shoemake Edward D | $116,400 |
Source: Public Records
Tax History
| Year | Tax Paid | Tax Assessment Tax Assessment Total Assessment is a certain percentage of the fair market value that is determined by local assessors to be the total taxable value of land and additions on the property. | Land | Improvement |
|---|---|---|---|---|
| 2025 | $2,541 | $18,525 | $1,514 | $17,011 |
| 2024 | $2,592 | $18,525 | $1,560 | $16,965 |
| 2023 | $2,592 | $19,525 | $1,786 | $17,739 |
| 2022 | $2,603 | $18,526 | $2,684 | $15,842 |
| 2021 | $2,433 | $18,526 | $2,684 | $15,842 |
| 2020 | $2,448 | $18,526 | $2,684 | $15,842 |
| 2019 | $2,458 | $18,526 | $2,684 | $15,842 |
| 2018 | $2,435 | $18,526 | $2,684 | $15,842 |
| 2017 | $2,419 | $19,526 | $2,829 | $16,697 |
| 2016 | $2,390 | $19,526 | $2,829 | $16,697 |
| 2015 | $2,286 | $25,285 | $3,663 | $21,622 |
| 2014 | $2,282 | $23,595 | $3,663 | $19,932 |
Source: Public Records
Map
Nearby Homes
- 9104 E 113th St S
- 8812 E 110th St
- 8702 E 110th Ct
- 9539 E 109th St S
- 10848 S 95th East Ave
- 10708 S 88th East Cir
- 10612 S 91st East Ave
- 10712 S 95th East Ct
- 4713 S Retana Ave
- 4705 S Retana Ave
- 4607 S Retana Place
- 10529 S 92nd East Cir
- 4401 S Yellow Pine Ave
- 6101 W Birmingham Cir
- 9528 E 117th St S
- 10524 S 91st East Ave
- 9705 E 116th Place S
- 8319 E 107th Place S
- 11711 S 96th East Place
- 4529 S Retana Ave
- 11101 S 90th East Ave
- 11225 S 90th Ave E
- 11225 S 90th East Ave
- 11204 S 91st East Ave
- 9302 E 110th St
- 11206 S 91st East Ave
- 10990 S 93rd East Ave
- 10990 S 93rd Ave E
- 11269 S 90th East Ave
- 11208 S 91st East Ave
- 11222 S 89th East Ave
- 9103 E 112th St S
- 9312 E 110th St
- 11203 S 91st East Ave
- 9322 E 110th St
- 11201 S 91st East Ave
- 11205 S 91st East Ave
- 11222 S 89th Ave E
- 8440 E 111th St S
- 10974 S 93rd East Ave
Your Personal Tour Guide
Ask me questions while you tour the home.