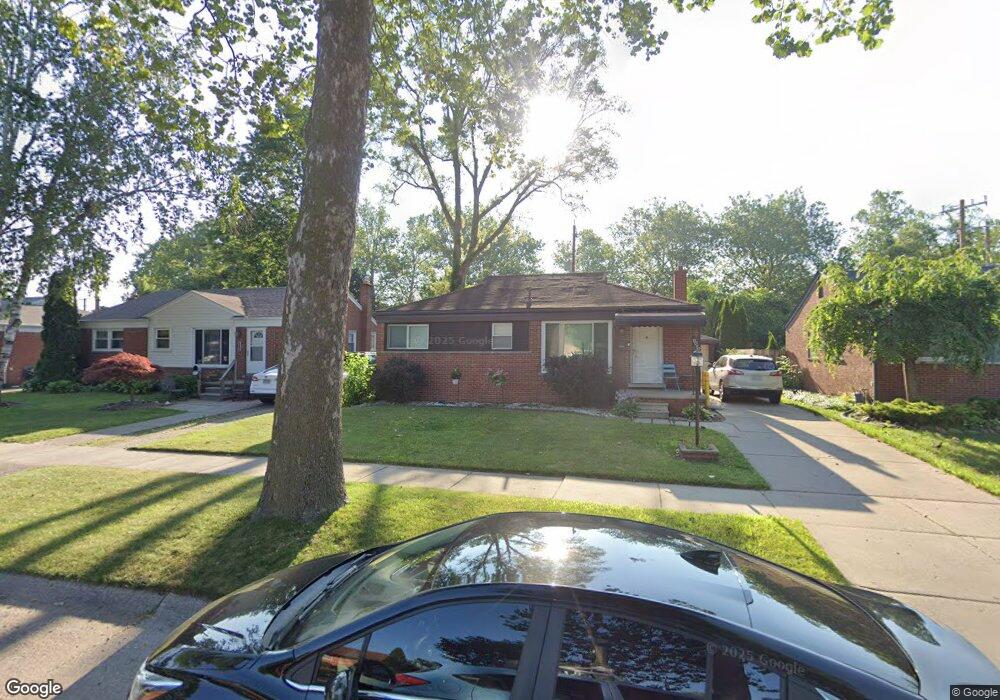
9040 Tecumseh Redford, MI 48239
Estimated Value: $192,195 - $227,000
3
Beds
2
Baths
1,008
Sq Ft
$211/Sq Ft
Est. Value
About This Home
This home is located at 9040 Tecumseh, Redford, MI 48239 and is currently estimated at $213,049, approximately $211 per square foot. 9040 Tecumseh is a home located in Wayne County with nearby schools including John D. Pierce Middle School, Lee M. Thurston High School, and Westfield Charter Academy.
Ownership History
Date
Name
Owned For
Owner Type
Purchase Details
Closed on
Aug 2, 2019
Sold by
Duais Eman
Bought by
Cope Ladana L
Current Estimated Value
Home Financials for this Owner
Home Financials are based on the most recent Mortgage that was taken out on this home.
Original Mortgage
$140,650
Outstanding Balance
$123,259
Interest Rate
3.73%
Mortgage Type
New Conventional
Estimated Equity
$89,790
Purchase Details
Closed on
Apr 9, 2019
Sold by
Ismair Albert
Bought by
Duais Eman
Purchase Details
Closed on
Mar 28, 2011
Sold by
Al Shaer Ramzi and Duais Eman Hani
Bought by
Ismair Albert
Purchase Details
Closed on
Jun 10, 2002
Sold by
Al Shaer Suzan
Bought by
Al Shaer Ramzi
Purchase Details
Closed on
Jul 31, 2000
Sold by
Robin Shaker
Bought by
Ramzi W Alshaer
Purchase Details
Closed on
Jul 16, 1997
Sold by
Glo Barbara L and Glo Ronald O
Bought by
Tamer Shaker
Create a Home Valuation Report for This Property
The Home Valuation Report is an in-depth analysis detailing your home's value as well as a comparison with similar homes in the area
Home Values in the Area
Average Home Value in this Area
Purchase History
| Date | Buyer | Sale Price | Title Company |
|---|---|---|---|
| Cope Ladana L | $145,000 | Liberty Title | |
| Duais Eman | $8,605 | None Available | |
| Ismair Albert | $30,000 | Title One Inc | |
| Al Shaer Ramzi | -- | -- | |
| Ramzi W Alshaer | $128,000 | -- | |
| Tamer Shaker | $100,000 | -- |
Source: Public Records
Mortgage History
| Date | Status | Borrower | Loan Amount |
|---|---|---|---|
| Open | Cope Ladana L | $140,650 |
Source: Public Records
Tax History
| Year | Tax Paid | Tax Assessment Tax Assessment Total Assessment is a certain percentage of the fair market value that is determined by local assessors to be the total taxable value of land and additions on the property. | Land | Improvement |
|---|---|---|---|---|
| 2025 | $1,438 | $86,600 | $0 | $0 |
| 2024 | $1,399 | $81,100 | $0 | $0 |
| 2023 | $1,340 | $71,400 | $0 | $0 |
| 2022 | $3,779 | $63,800 | $0 | $0 |
| 2021 | $3,672 | $60,700 | $0 | $0 |
| 2020 | $3,620 | $54,600 | $0 | $0 |
| 2019 | $2,732 | $48,100 | $0 | $0 |
| 2018 | $915 | $40,700 | $0 | $0 |
| 2017 | $3,166 | $38,500 | $0 | $0 |
| 2016 | $1,975 | $34,500 | $0 | $0 |
| 2015 | $2,694 | $30,800 | $0 | $0 |
| 2013 | $2,610 | $26,600 | $0 | $0 |
| 2012 | $1,616 | $28,900 | $7,400 | $21,500 |
Source: Public Records
Map
Nearby Homes
- 26740 Joy Rd Unit 8
- 26760 Joy Rd Unit E8
- 26710 Joy Rd Unit A
- 26710 Joy Rd Unit A, 10
- 9010 Leverne
- 9101 Sioux
- 8915 Sioux
- 26790 Joy Rd Unit 7
- 27007 Joy Rd
- 9130 Kinloch
- 9624 Nathaline
- 9540 Mercedes
- 26923 Constance St
- 9619 Mercedes
- 8537 Mercedes St
- 26030 W Chicago
- 25968 Keith St
- 9983 Hemingway
- 9114 Cardwell St
- 25761 Jennifer
Your Personal Tour Guide
Ask me questions while you tour the home.