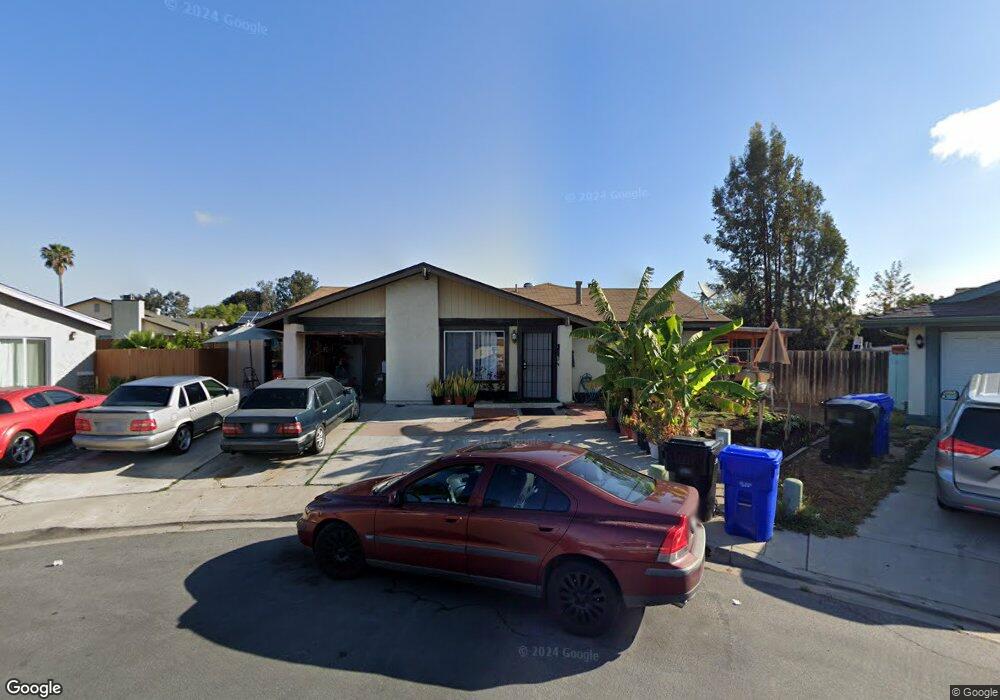
9044 Bogata Cir San Diego, CA 92126
Mira Mesa NeighborhoodEstimated Value: $947,389 - $1,041,000
4
Beds
2
Baths
1,194
Sq Ft
$832/Sq Ft
Est. Value
About This Home
This home is located at 9044 Bogata Cir, San Diego, CA 92126 and is currently estimated at $992,847, approximately $831 per square foot. 9044 Bogata Cir is a home located in San Diego County with nearby schools including Hage Elementary School, Wangenheim Middle School, and Mira Mesa High School.
Ownership History
Date
Name
Owned For
Owner Type
Purchase Details
Closed on
Apr 29, 1996
Sold by
Va
Bought by
Casinio Domingo L and Casinio Rosalinda M
Current Estimated Value
Home Financials for this Owner
Home Financials are based on the most recent Mortgage that was taken out on this home.
Original Mortgage
$100,000
Outstanding Balance
$5,532
Interest Rate
7.68%
Mortgage Type
Seller Take Back
Estimated Equity
$987,315
Purchase Details
Closed on
Mar 27, 1995
Sold by
Citicorp Mtg Inc
Bought by
Va
Purchase Details
Closed on
Mar 24, 1995
Sold by
Citicorp Mtg Inc and Cline Richard W
Bought by
Citicorp Mtg Inc
Purchase Details
Closed on
Jun 25, 1994
Sold by
Cline Richard W and Cline Lori R
Bought by
Boston Harbor Corp
Purchase Details
Closed on
Jun 5, 1989
Purchase Details
Closed on
Jun 15, 1984
Create a Home Valuation Report for This Property
The Home Valuation Report is an in-depth analysis detailing your home's value as well as a comparison with similar homes in the area
Home Values in the Area
Average Home Value in this Area
Purchase History
| Date | Buyer | Sale Price | Title Company |
|---|---|---|---|
| Casinio Domingo L | $100,000 | First American Title Ins Co | |
| Va | -- | Fidelity National Title Ins | |
| Citicorp Mtg Inc | $112,801 | Fidelity National Title Ins | |
| Boston Harbor Corp | -- | -- | |
| -- | $139,000 | -- | |
| -- | $84,900 | -- |
Source: Public Records
Mortgage History
| Date | Status | Borrower | Loan Amount |
|---|---|---|---|
| Open | Casinio Domingo L | $100,000 |
Source: Public Records
Tax History Compared to Growth
Tax History
| Year | Tax Paid | Tax Assessment Tax Assessment Total Assessment is a certain percentage of the fair market value that is determined by local assessors to be the total taxable value of land and additions on the property. | Land | Improvement |
|---|---|---|---|---|
| 2025 | $2,747 | $230,933 | $116,273 | $114,660 |
| 2024 | $2,747 | $226,406 | $113,994 | $112,412 |
| 2023 | $2,684 | $221,967 | $111,759 | $110,208 |
| 2022 | $2,610 | $217,616 | $109,568 | $108,048 |
| 2021 | $2,590 | $213,350 | $107,420 | $105,930 |
| 2020 | $2,558 | $211,163 | $106,319 | $104,844 |
| 2019 | $2,511 | $207,024 | $104,235 | $102,789 |
| 2018 | $2,348 | $202,966 | $102,192 | $100,774 |
| 2017 | $2,287 | $198,988 | $100,189 | $98,799 |
| 2016 | $2,248 | $195,087 | $98,225 | $96,862 |
| 2015 | $2,214 | $192,158 | $96,750 | $95,408 |
| 2014 | $2,179 | $188,395 | $94,855 | $93,540 |
Source: Public Records
Map
Nearby Homes
- 8943 Calliandra Rd
- 10805 Eberly Ct
- 10770 Black Mountain Rd Unit 220
- 10770 Black Mountain Rd
- 8727 Westmore Rd Unit 24
- 8669 Summerdale Rd
- 10582 Caminito Glenellen
- 8670 New Salem St
- 8650 New Salem St Unit 27
- 8644 New Salem St Unit 6
- 8654 New Salem St Unit 44
- 10771 Black Mountain Rd Unit 58
- 8595 Summerdale Rd Unit 170
- 9310 Galvin Ave Unit 15
- 8849 Capricorn Way
- 8485 Westmore Rd Unit 40
- 8488 New Salem St
- 8476 New Salem St Unit 77
- 8479 Westmore Rd Unit 55
- 10422 Londonderry Ave
- 9047 Bogata Cir
- 9027 Westmore Rd
- 9033 Westmore Rd
- 9021 Westmore Rd
- 9037 Bogata Cir
- 9034 Bogata Cir
- 9039 Westmore Rd
- 9015 Westmore Rd
- 9027 Bogata Cir
- 9045 Westmore Rd
- 9024 Bogata Cir
- 9051 Westmore Rd
- 9009 Westmore Rd
- 9017 Bogata Cir
- 8998 Via Caracas
- 9003 Westmore Rd
- 8992 Via Caracas
- 9007 Bogata Cir
- 9016 Westmore Rd
- 8995 Westmore Rd