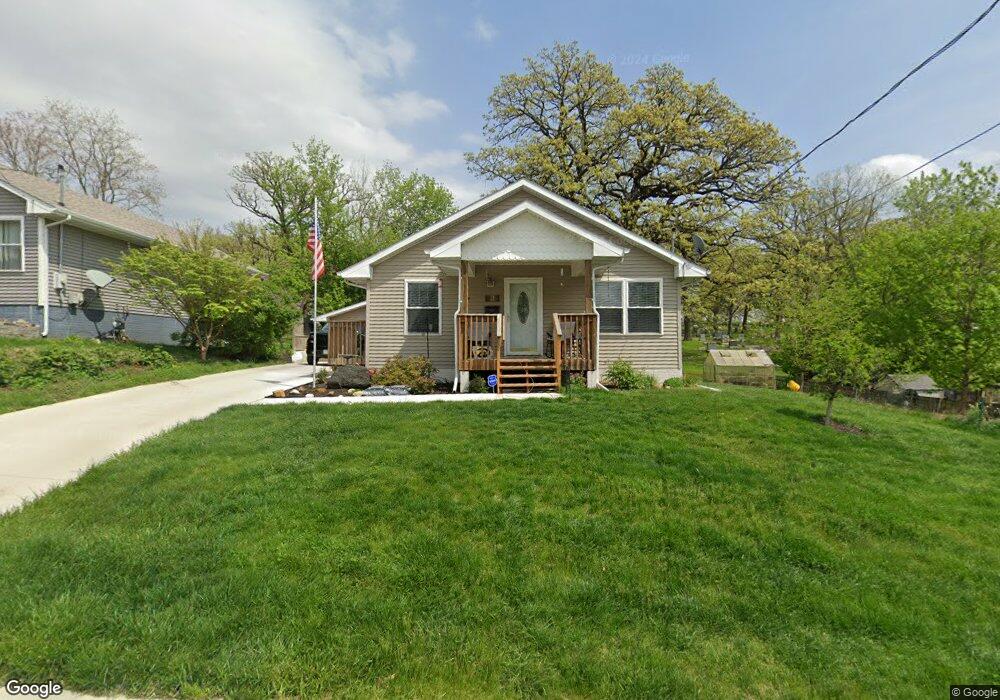
905 23rd St Des Moines, IA 50312
Woodland Heights NeighborhoodEstimated Value: $239,000 - $263,446
3
Beds
1
Bath
1,071
Sq Ft
$238/Sq Ft
Est. Value
About This Home
This home is located at 905 23rd St, Des Moines, IA 50312 and is currently estimated at $255,362, approximately $238 per square foot. 905 23rd St is a home located in Polk County with nearby schools including Callanan Middle School and Roosevelt High School.
Ownership History
Date
Name
Owned For
Owner Type
Purchase Details
Closed on
Nov 15, 2021
Sold by
City Of Des Moines Iowa
Bought by
Brown Gregory P
Current Estimated Value
Purchase Details
Closed on
Jun 13, 2017
Sold by
Brown Megan Ann
Bought by
Brown Gregory Patrick
Purchase Details
Closed on
Jun 17, 2003
Sold by
Keystone Construction Lc
Bought by
Brown Gregory P
Home Financials for this Owner
Home Financials are based on the most recent Mortgage that was taken out on this home.
Original Mortgage
$103,050
Interest Rate
5.51%
Mortgage Type
Purchase Money Mortgage
Create a Home Valuation Report for This Property
The Home Valuation Report is an in-depth analysis detailing your home's value as well as a comparison with similar homes in the area
Home Values in the Area
Average Home Value in this Area
Purchase History
| Date | Buyer | Sale Price | Title Company |
|---|---|---|---|
| Brown Gregory P | -- | None Available | |
| Brown Gregory Patrick | -- | None Available | |
| Brown Gregory P | $114,500 | -- |
Source: Public Records
Mortgage History
| Date | Status | Borrower | Loan Amount |
|---|---|---|---|
| Previous Owner | Brown Gregory P | $103,050 |
Source: Public Records
Tax History
| Year | Tax Paid | Tax Assessment Tax Assessment Total Assessment is a certain percentage of the fair market value that is determined by local assessors to be the total taxable value of land and additions on the property. | Land | Improvement |
|---|---|---|---|---|
| 2025 | $4,730 | $278,700 | $32,000 | $246,700 |
| 2024 | $4,730 | $250,900 | $28,100 | $222,800 |
| 2023 | $4,420 | $250,900 | $28,100 | $222,800 |
| 2022 | $4,384 | $196,400 | $22,900 | $173,500 |
| 2021 | $4,168 | $196,400 | $22,900 | $173,500 |
| 2020 | $4,324 | $175,600 | $20,500 | $155,100 |
| 2019 | $3,976 | $175,600 | $20,500 | $155,100 |
| 2018 | $3,932 | $156,500 | $17,900 | $138,600 |
| 2017 | $3,856 | $156,500 | $17,900 | $138,600 |
| 2016 | $3,752 | $151,100 | $16,900 | $134,200 |
| 2015 | $3,752 | $151,100 | $16,900 | $134,200 |
| 2014 | $3,392 | $141,400 | $15,600 | $125,800 |
Source: Public Records
Map
Nearby Homes
Your Personal Tour Guide
Ask me questions while you tour the home.